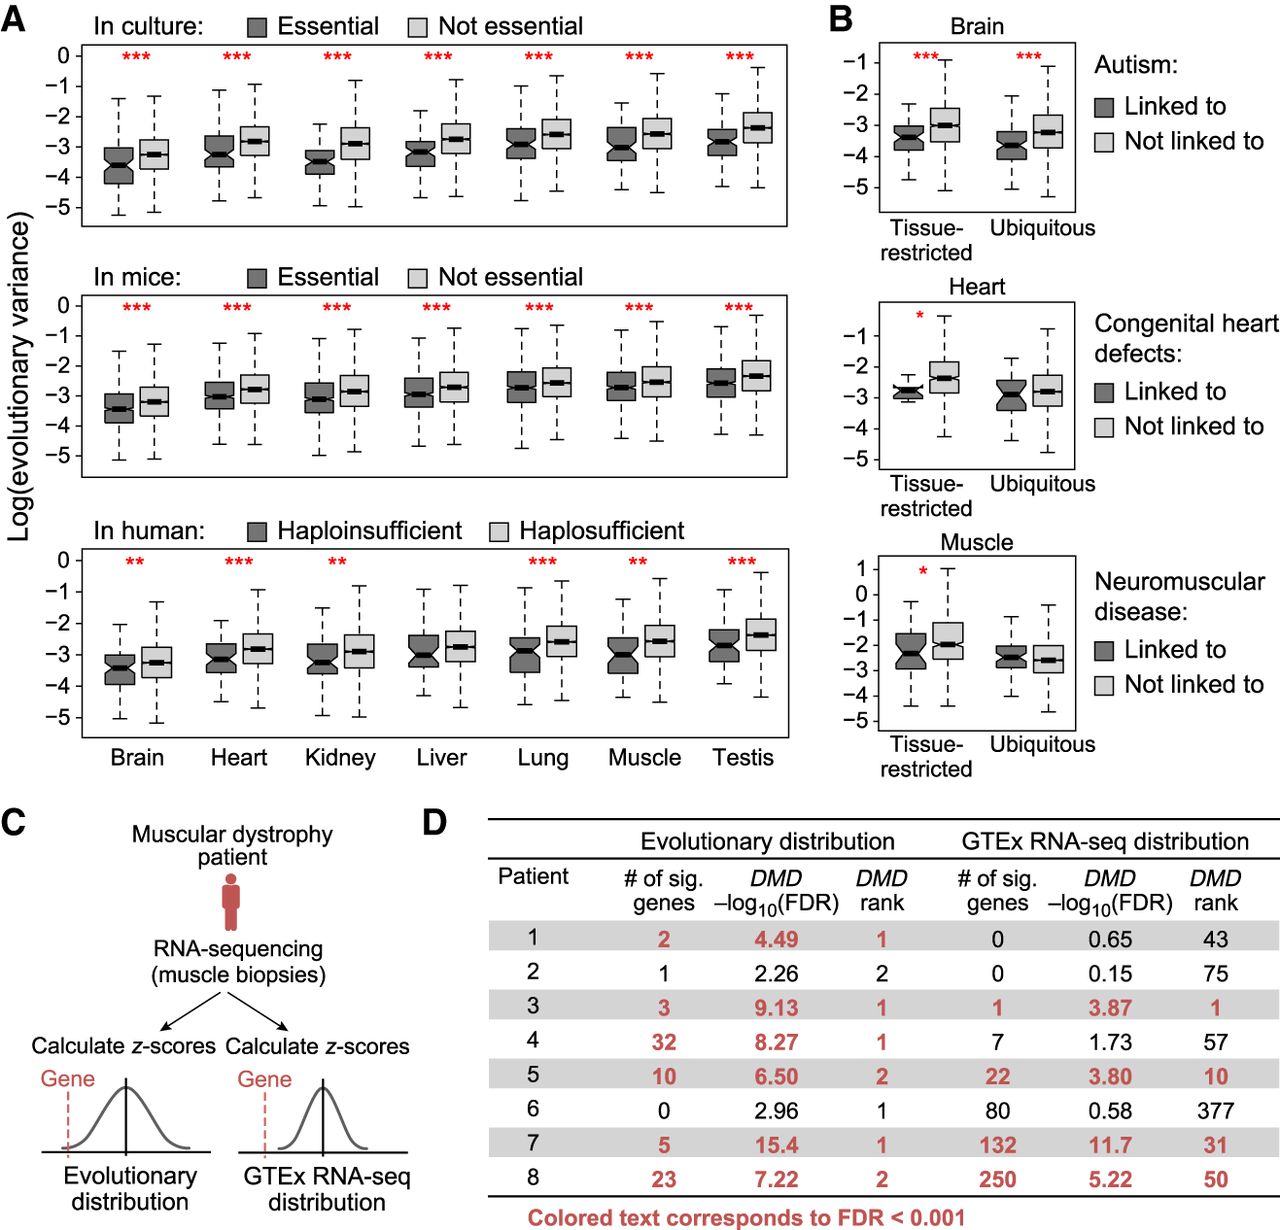
Evolutionary distribution of gene expression helps identify disease-contributing genes. (A) Essential genes have lower evolutionary variance. Box plots show the distribution of log(evolutionary variance) (y-axis) of genes essential in culture (top), essential in mice (middle), and haploinsufficient in human (bottom; dark gray), and their nonessential or haplosufficient counterparts (light gray) in each of seven tissues (x-axis): (***) P < 0.001; (**) P < 0.01. (B) Disease genes have lower evolutionary variance. Box plots show the distribution of log(evolutionary variance) (y-axis) of genes linked (dark gray) and not linked (light gray) to high-penetrance monogenic autism spectrum disorder (top), congenital heart defects (middle), and neuromuscular disease (bottom) in the relevant tissue (brain, heart, and muscle, respectively). (Left) Genes that are restricted in expression (>5 TPM in three or fewer tissues) in that tissue; (right) genes that are ubiquitously expressed; (***) P < 0.001; (*) <0.05. (C,D) Overview of using evolutionary distributions or GTEx RNA-seq distributions to identify outlier gene expression from RNA-seq of muscular dystrophy patients. (C) Two scoring approaches based on evolutionary distributions (left) or GTEx RNA-seq distributions (right). (D) Table shows number of significant outlier genes, −log10FDR score, and DMD’s significance rank for all patients with muscular dystrophy when using distributions estimated from evolutionary data (left) or GTEx RNA-seq data (right).