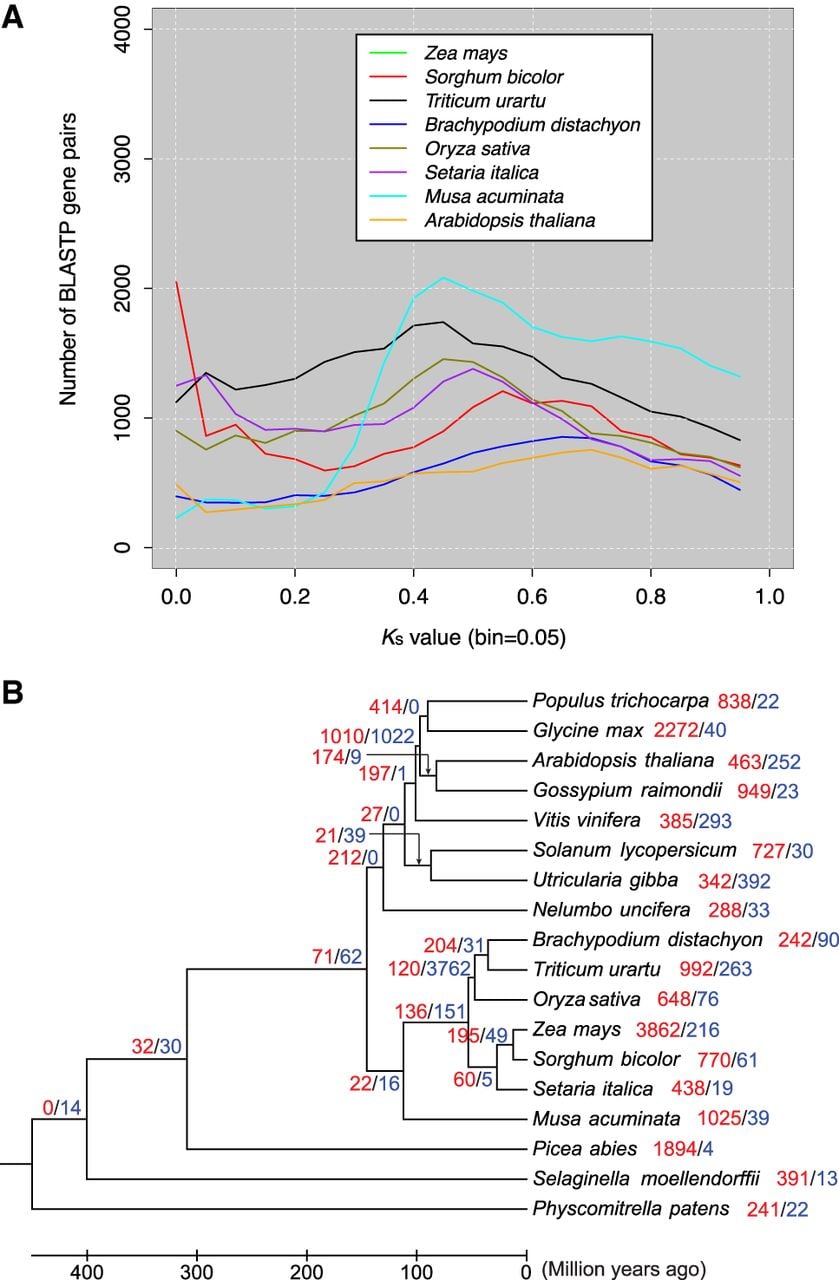
Figure 4.
Evolution of plant gene family size. (A) Histogram of Ks values of all paralogous gene pairs identified by BLASTP with P-value < 1 × 10⁻¹⁰ and alignment accounting for >80% of gene length (removing partially aligned pairs). (B) Expansion and contraction of gene families in major flowering plant lineages using the CAFE algorithm (De Bie et al. 2006). The number of expansions is marked as red and contractions as blue.