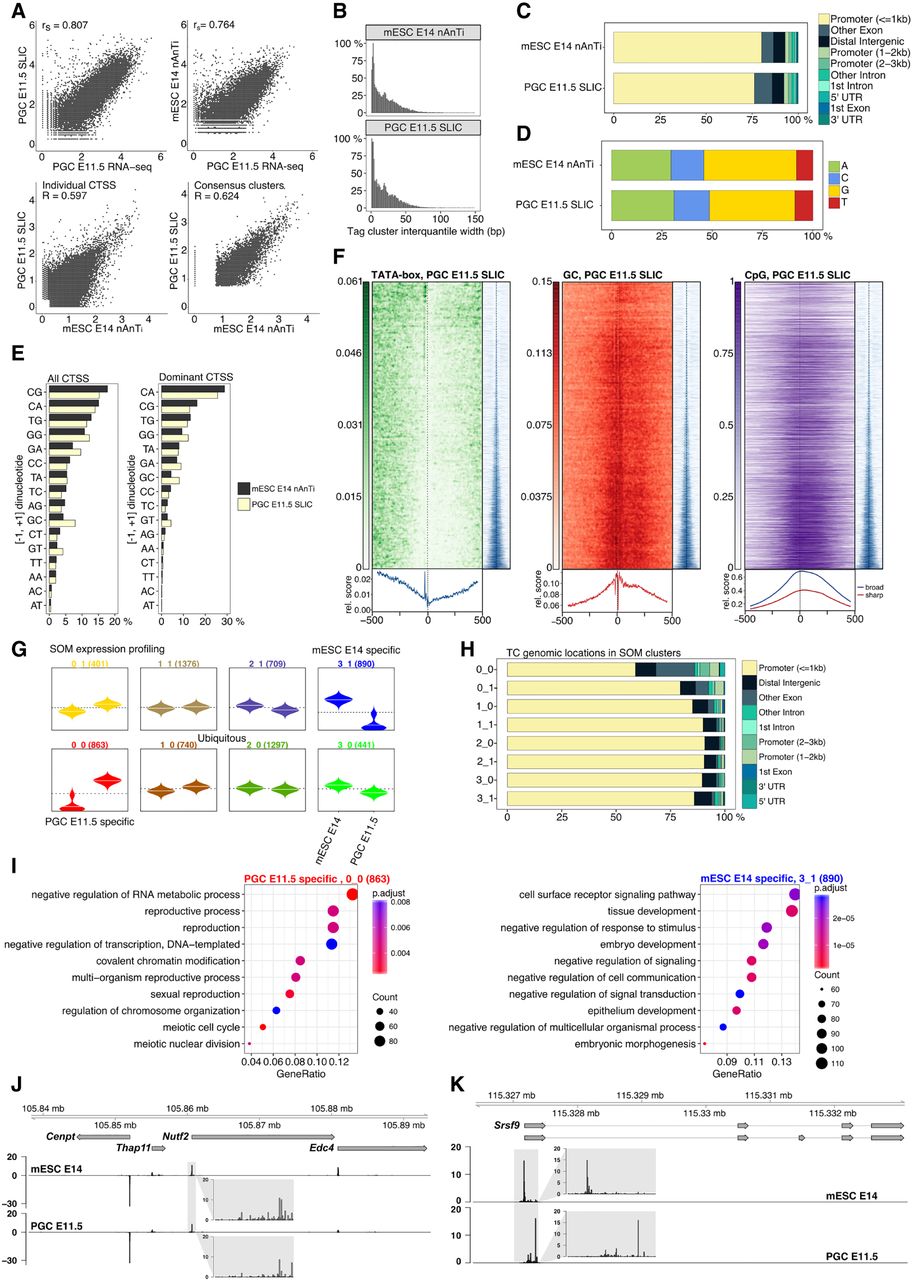
TSS landscape of primordial germ cell E11.5 stage. (A) Spearman's correlation of SLIC-CAGE PGC E11.5 data with PGC E11.5 RNA-seq data (upper left) or nAnT-iCAGE mESC E14 data with PGC E11.5 RNA-seq data (upper right panel). Pearson's correlation of SLIC-CAGE PGC E11.5 and nAnT-iCAGE mESC E14 data sets on individual CTSS level (lower left) or consensus tag cluster/promoter level (lower right panel). Comparison of nAnT-iCAGE mESC E14 and SLIC-CAGE PGC E11.5 libraries: (B) distribution of tag cluster inter-quantile widths; (C) genomic locations of tag clusters; (D) nucleotide composition of all CTSSs; (E) dinucleotide composition of all CTSSs (left panel) or dominant CTSSs (right panel). Both panels are ordered from the most- to the least-used dinucleotide in the mESC E14 library. (F) TATA-box (14.3% of TCs have a TATA-box around −30 position), GC dinucleotide, and CpG island density in PGC E11.5 data (67.3% TCs overlap CpG islands). In all heat maps, promoters are centered at the dominant CTSS (dashed vertical line at 0). Promoter regions are scanned using a minimum of the 80th percentile match to the TATA-box PWM. The signal metaplot is shown below each heat map, and a tag cluster IQ-width coverage (in blue) shows ordering in the pattern heat map from sharp to broad tag clusters/promoters (200-bp window centered on dominant TSS). (G) Expression profiles obtained by SOM clustering of tag-clusters/promoters. Each box represents one cluster, left beanplots represent mESC E14 and right beanplots represent PGC E11.5. The horizontal line denotes the mean expression level in each cluster. (H) Genomic locations of tag cluster in each SOM class (SOM-classes are shown on the y-axis). (I) Biological process GO analysis in PGC E11.5-specific SOM class 0_0 (left) and mESC E14-specific class 3_1 (right). (J) CTSS signal in example locus on Chromosome 8 (same as in Fig. 1I) and (K) CTSS signal in Srsf9 promoter region (Chr 5) exhibiting TSS switching in PGC E11.5 compared to mESC E14 (distance between dominant CTSSs is 180 bp). Two transcript variants are shown where thin lines depict introns. The inset gray boxes show magnification of tag clusters.