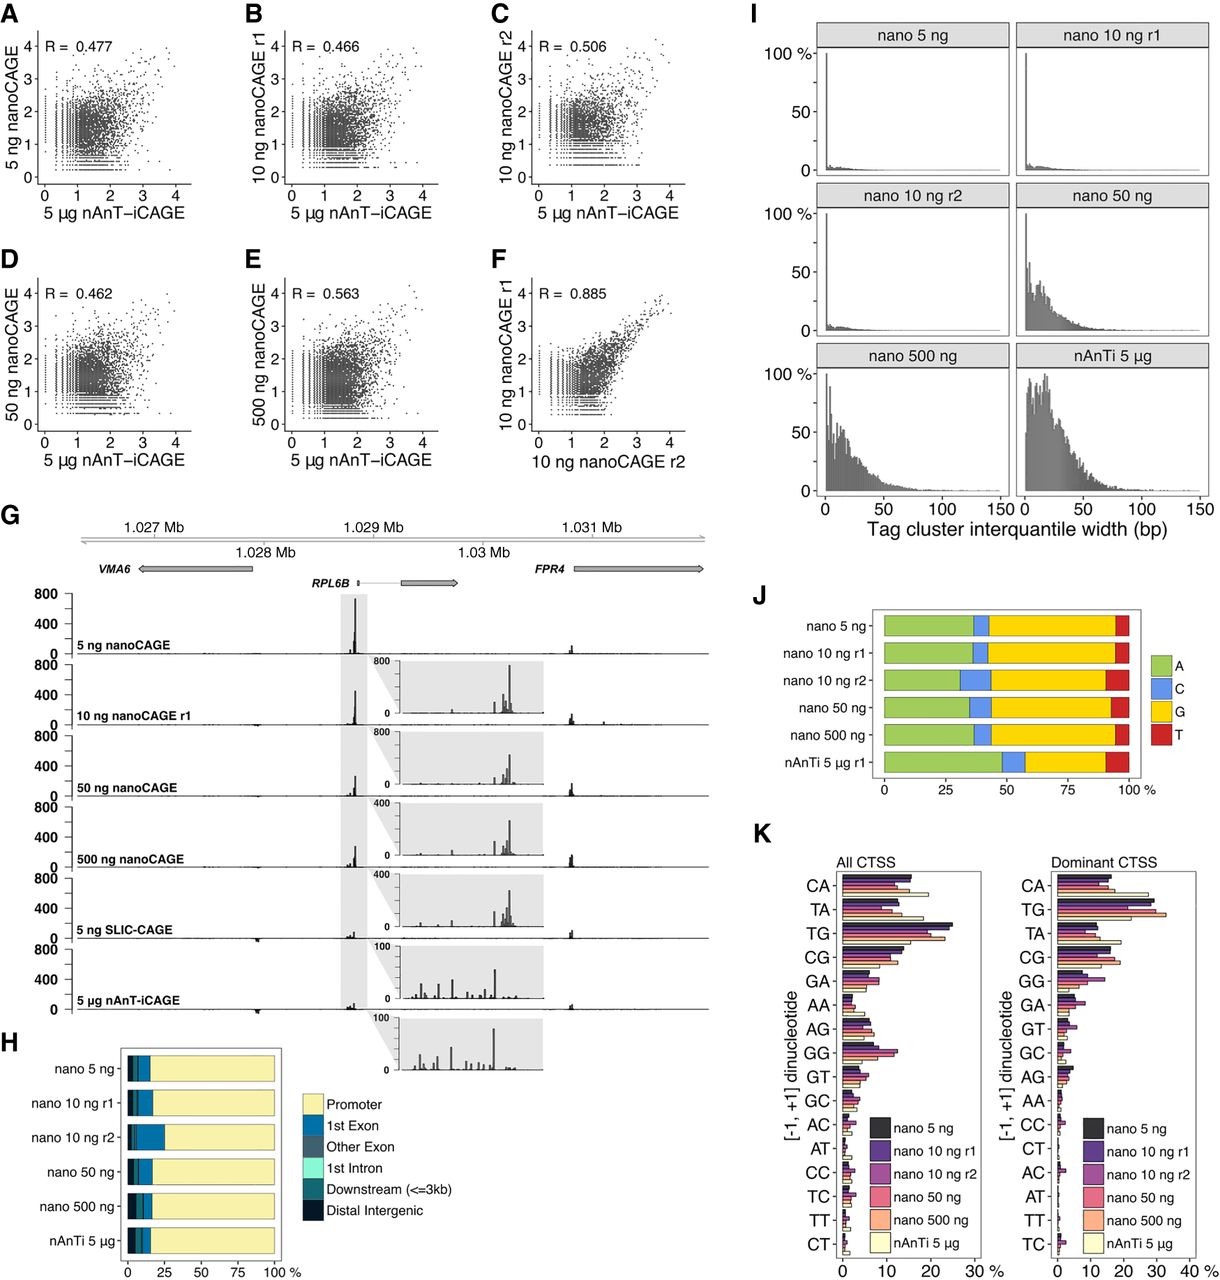
Comparison of nanoCAGE and the reference nAnT-iCAGE. (A–E) Pearson's correlation of nAnT-iCAGE and nanoCAGE libraries prepared from (A) 5 ng, (B,C) 10 ng, (D) 50 ng, or (E) 500 ng of S. cerevisiae total RNA. (F) Pearson's correlation of nanoCAGE technical replicates prepared from 10 ng of S. cerevisiae total RNA. (G) CTSS signal in example locus on Chromosome 12 in nanoCAGE libraries prepared from 5, 10, 50, or 500 ng, SLIC-CAGE library prepared from 5 ng and the nAnT-iCAGE library prepared from 5 µg of S. cerevisiae total RNA (the same locus is shown in Fig. 1E). The inset gray boxes show a magnification of a tag cluster. Insets in nanoCAGE libraries have a different scale, as signal is skewed with PCR amplification. Different tag cluster is magnified compared to Figure 1E, as nanoCAGE did not detect the upstream tag cluster on the minus strand. Additional validation is presented in Supplementary Figure S22. (H) Genomic locations of tag clusters identified in nanoCAGE libraries prepared from 5 to 500 ng of S. cerevisiae total RNA and in the nAnT-iCAGE library. (I) Distribution of tag cluster inter-quantile widths in nanoCAGE libraries prepared from 5 to 500 ng of S. cerevisiae total RNA versus the reference nAnT-iCAGE library. (J) Nucleotide composition of all CTSSs identified in nanoCAGE libraries prepared from 5 to 500 ng of S. cerevisiae total RNA or identified in the reference nAnT-iCAGE library. (K) Dinucleotide composition of all CTSSs (left panel) or dominant CTSSs (right panel) identified in nanoCAGE libraries prepared from 5 to 500 ng of S. cerevisiae total RNA or in the reference nAnT-iCAGE library. Both panels are ordered from the most to the least used dinucleotide in the reference nAnT-iCAGE.