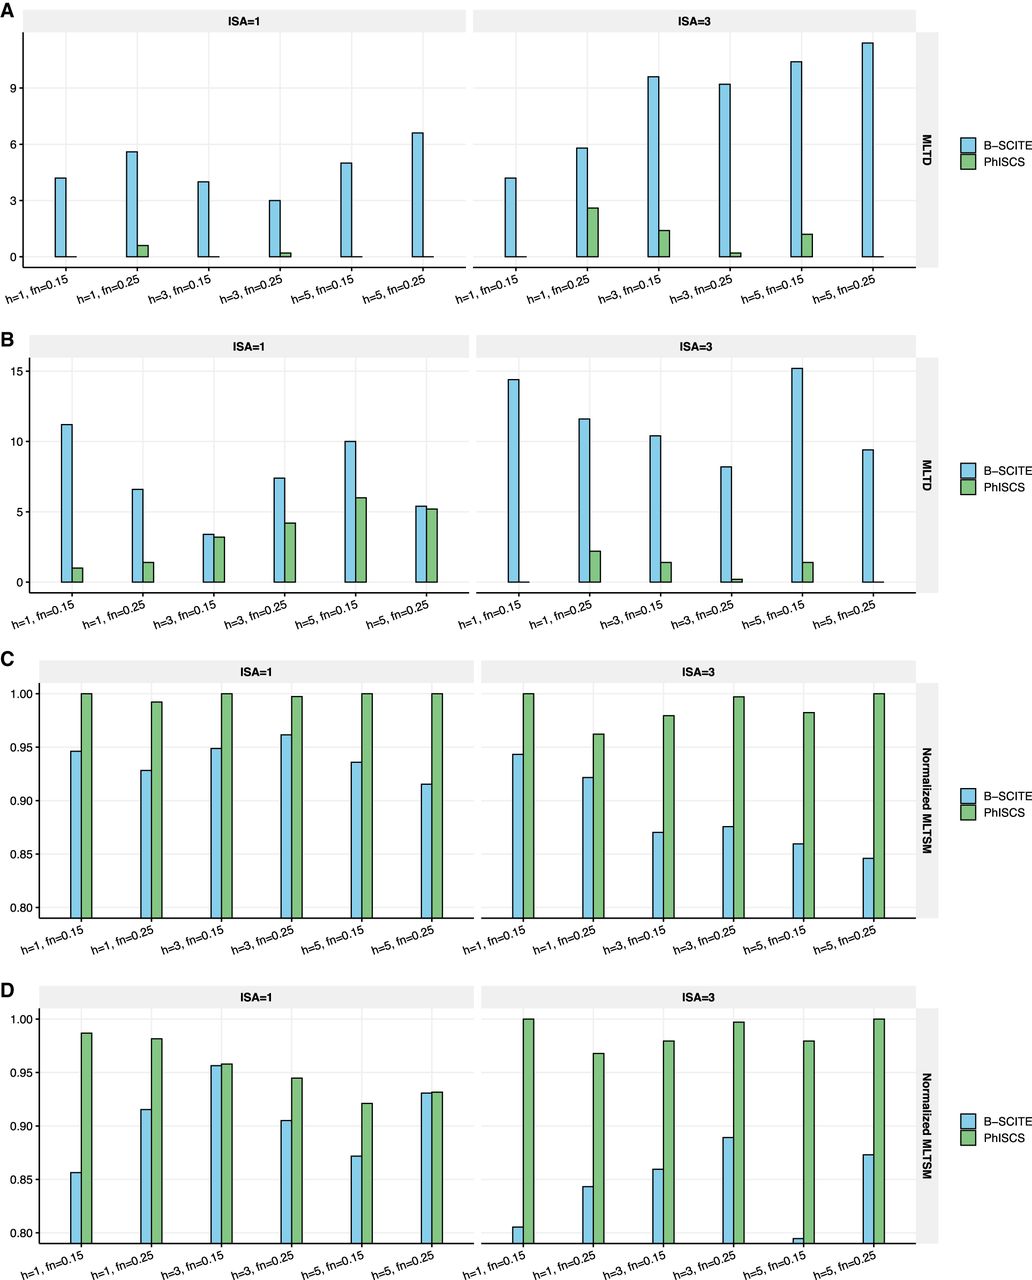
Comparison of PhISCS and B-SCITE according to MLTD and its dual MLTSM similarity measure (normalized values of MLTSM are shown in the figure). In each case, 10 trees of tumor evolution with seven subclones and 40 mutations were simulated and 100 single cells were sampled. Depth of coverage for bulk data was set to 5000×. More details about generating these simulations are provided in the Supplemental Material. A and B show MLTD (dissimilarity) between inferred and ground truth trees for cases where three SNVs fall into regions having copy number 3 (A) or 4 (B) in all cancerous cells (i.e., clonal copy number gains 1 or 2 copies of genomic region harboring SNV). C and D show normalized MLTSM (similarity) between inferred and ground truth trees for cases where three SNVs fall into regions having copy number 3 (C) or 4 (D) in all cancerous cells. On the x-axes, h, fn, and ISA, respectively, denote the number of bulk samples, false negative rate of single-cell data, and the number of simulated mutations for which ISA is violated.