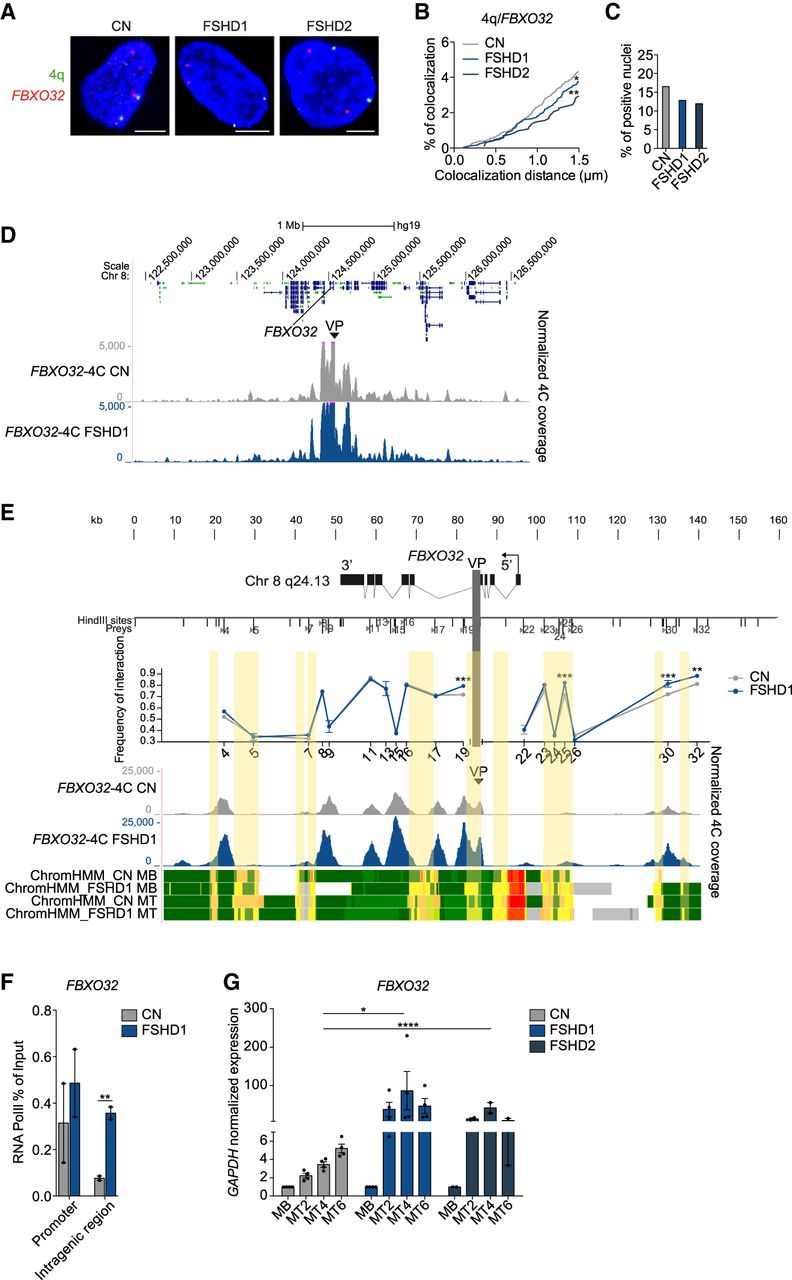
FBXO32 gene has a deregulated chromatin structure, and it is overexpressed in FSHD1 and FSHD2 muscle cells. (A) Representative nuclei of 3D multicolor DNA FISH using probes mapping to 4q35.1 region (4q; green) and FBXO32 (red) in CN (CN-1, CN-3, CN-4), FSHD1 (FSHD1-1, FSHD1-3, FSHD1-4), and FSHD2 (FSHD2-1, FSHD2-2) MBs. Nuclei are counterstained with DAPI (blue). All images are at 63× magnification. Scale bar, 5 µm. (B) Cumulative frequency distribution of distances (below 1.5 µm) between 4q and FBXO32 in CN (gray), FSHD1 (blue), and FSHD2 (dark blue) MBs. n = 3652 (CN), 2464 (FSHD1), and 1020 (FSHD2). P-values were calculated by unpaired one-tailed t-test with a confidence interval of 99%. Asterisks represent statistical P-values: for CN versus FSHD1, P = 0.0473; for CN versus FSHD2, P = 0.0036. (C) Percentage of nuclei positive for the interactions (under the cutoff of 1.5 µm). n = 913 (CN), 616 (FSHD1), and 255 (FSHD2). (D) 4C normalized coverage tracks at the FBXO32 locus for FBXO32-4C VP in CN (CN-3, CN-4; gray) and FSHD1 (FSHD1-3, FSHD1-4; blue). (E, top) Schematic representation of the FBXO32 locus and HindIII sites. (Middle) Chart showing the frequencies of 3C interaction between FBXO32 promoter and the indicated HindIII restriction sites (sites 4–32), using the same bait of the 4C VP (light gray vertical bar) in CN (gray) and FSHD (blue). n = 3 (CN) and 3 (FSHD1). SEM is indicated. P-values were calculated by two-way ANOVA followed by Bonferroni posttest correction. Asterisks represent statistical P-values: for P19, P25, and P30 CN versus FSHD1, P < 0.001; for P32 CN versus FSHD1, P < 0.01. (Bottom) 4C normalized coverage tracks as well as ChromHMM chromatin states tracks at the FBXO32 locus for FBXO32-4C VP in CN (gray) and FSHD1 (blue). The arrow represents the promoter region; enhancers are highlighted in yellow. (F) Bar plot showing enrichment of RNA Pol II at FBXO32 promoter (left) and an intragenic region (right) assessed by ChIP-qPCR experiment in CN (gray) and FSHD1 (blue) MBs. Results are presented as a percentage of input. n = 2 CN (CN-3, CN-4) and 2 FSHD1 (FSHD1-3, FSHD1-4). SEM is indicated. P-values were calculated by unpaired one-tailed t-test with a confidence interval of 99%. Dots represent the values of each replicate; asterisks represent statistical P-values: for FBXO32 intragenic region CN versus FSHD1, P = 0.0050. (G) Expression levels of FBXO32 gene during CN (gray), FSHD1 (blue), and FSHD2 (dark blue) differentiation. (MT2) Myotubes day 2, (MT4) myotubes day 4, (MT6) myotubes day 6. Data were normalized on GAPDH expression and on MBs. n = 4 CN (CN-1, CN-2, CN-3, CN-4), 4 FSHD1 (FSHD1-1, FSHD1-2, FSHD1-3, FSHD1-4), and 2 FSHD2 (FSHD2-1, FSHD2-2). SEM is indicated. P-values were calculated by two-way ANOVA followed by Bonferroni posttest correction. Dots represent the values of each replicate; asterisks represent statistical P-values: for MT4, CN versus FSHD1, P < 0.0290; CN versus FSHD2, P < 0.0001.