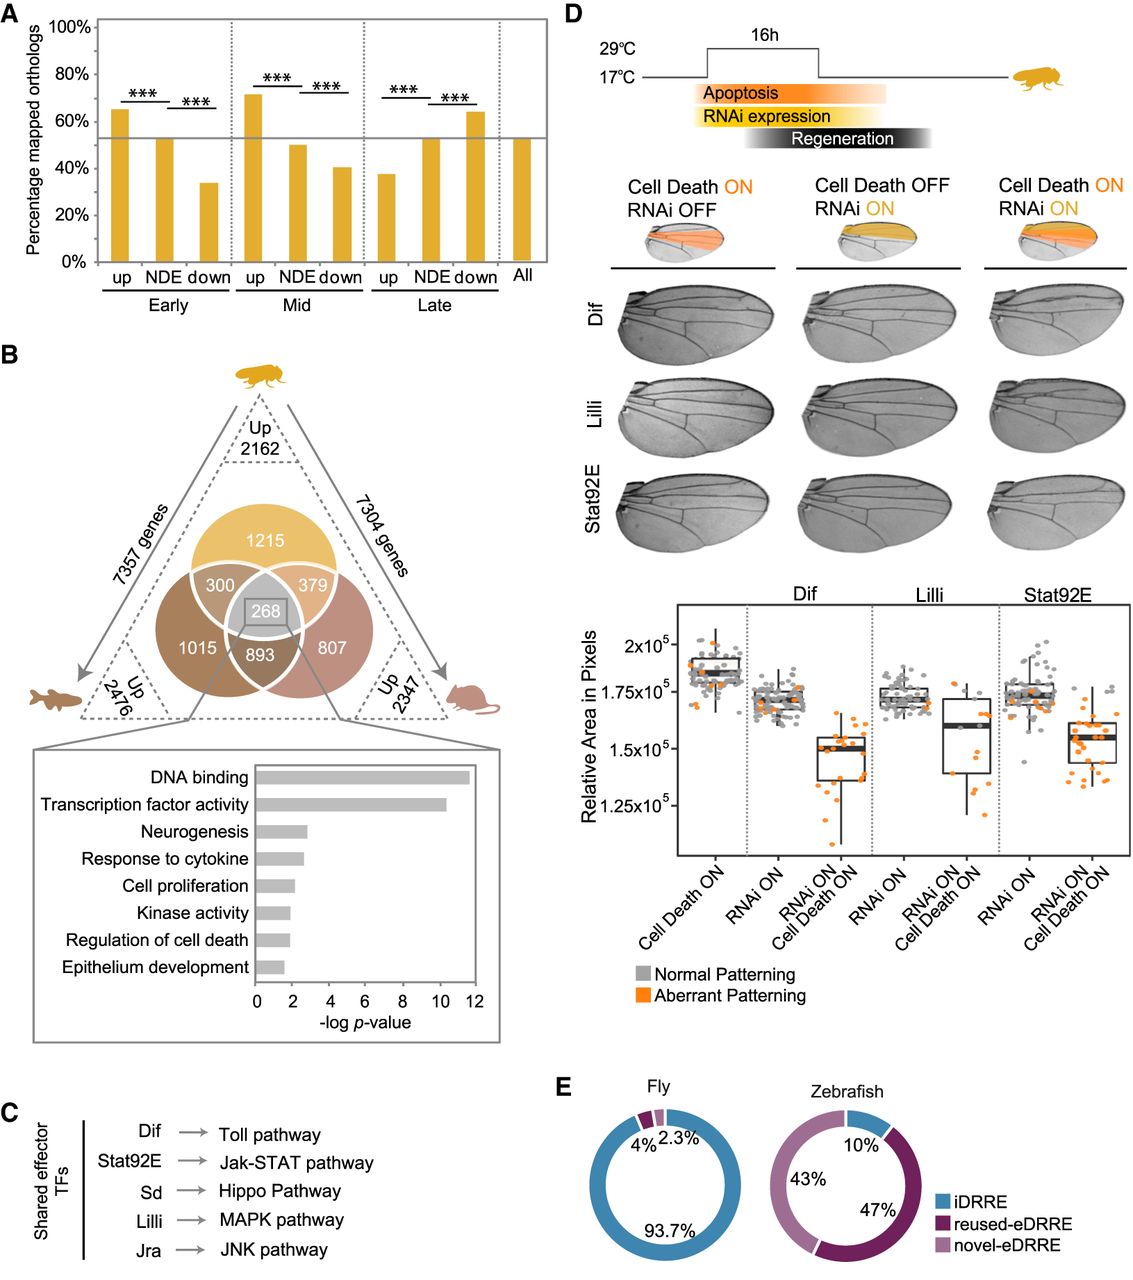
Conservation of regenerative features. (A) Bar plot showing the percentage of fly genes with an ortholog in zebrafish, mouse, or both at each time point and for each set of genes (up-regulated, nondifferentially expressed [NDE], and down-regulated). This percentage for all fly protein-coding genes is also shown and highlighted as a horizontal line. (B) Venn diagram showing the intersection of up-regulated genes that have an ortholog in a fly-oriented way. Numbers on the axes outside the triangle indicate the number of fly genes that map an ortholog in zebrafish and mouse. Numbers at vertices indicate the number of up-regulated orthologs in regeneration and in each species. The set of up-regulated genes shared between the three species is highlighted, and the bar plot shows GO term enrichment for them. (C) Up-regulated and shared TFs acting as effectors of regeneration signaling pathways. (D) Schematic representation of the experimental design used to score the capacity to regenerate after the depletion of a gene by RNAi and the induction of cell death (top). Adult wings showing the predominant phenotype observed in each condition (middle). The region where the RNAi was expressed is highlighted in yellow and the apoptotic region in orange. The box plot shows the average area of adult wings obtained after the expression of cell death, the RNAi, or the combination of both (bottom). Each dot represents one wing; wild-type pattern (gray) and aberrant pattern (orange). (E) Classification of DRREs identified in fly and zebrafish as novel eDRREs, reused eDRREs, and iDRREs based on co-option from embryo stages.