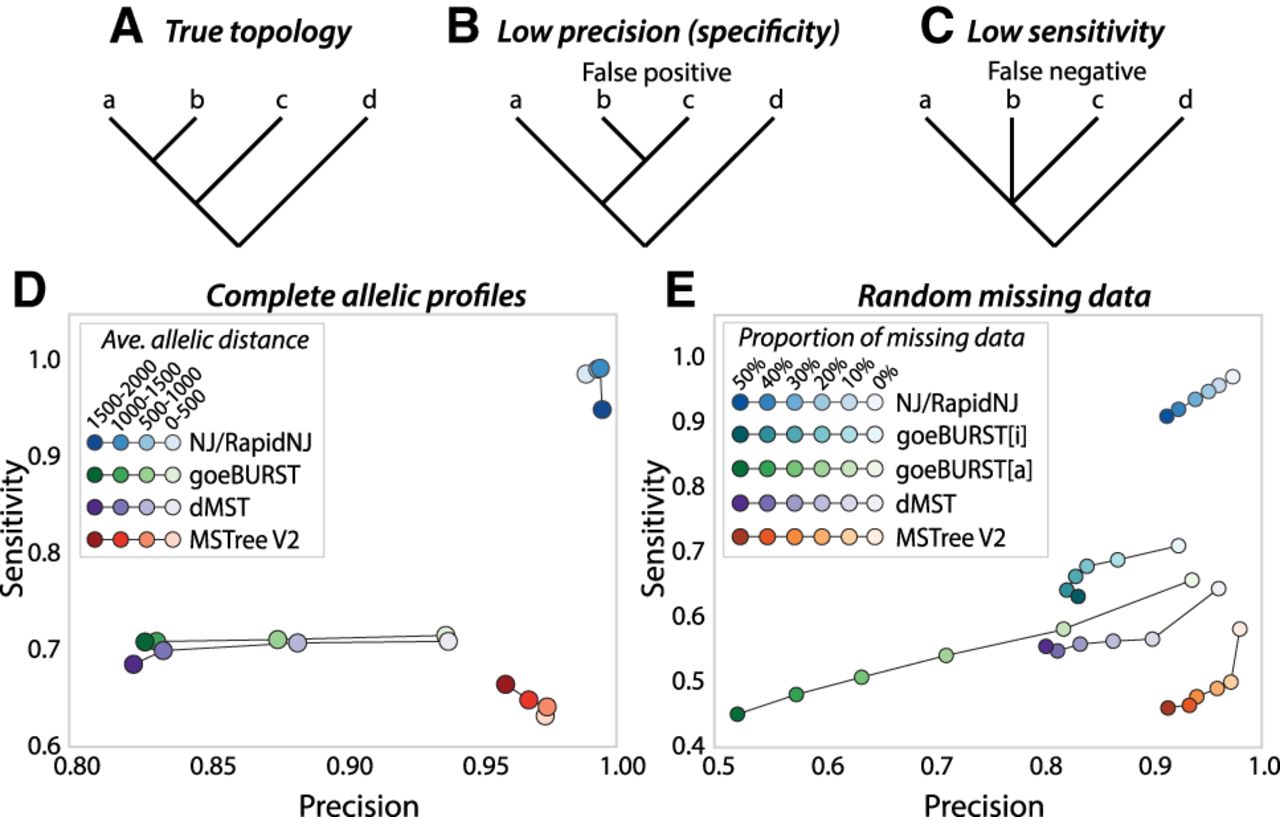
Precision and sensitivity of trees calculated by different algorithms from simulated allelic data. Trees were calculated for 100 replicates from each of 24 simulated phylogenies that differed in substitution rates (0.00001–0.07). (A–C) Cartoon trees demonstrating the true topology (A), low precision due to false positives (B), and low sensitivity due to false negatives (C). (D) Average sensitivity vs. precision in the absence of missing data after quartet analysis of branches calculated by NJ, goeBURST, the dMST intermediate stage prior to local branch recrafting in MSTree V2, and the full MSTree V2 algorithm including local branch recrafting. Values calculated by the quartet analyses were assigned to four bins according to allelic distances as indicated in the key. (E) Average sensitivity vs. precision after quartet analysis of branches calculated with different levels of random missing data for substitution rate 0.00005. goeBURST was forced to treat missing values as additional alleles by encoding them as 0 (goeBURST[a]) or to ignore them by encoding them as “–” (goeBURST[i]; defaults in MSTree). Values calculated by the quartet analyses were assigned to six bins according to the proportion of missing data as indicated in the key.