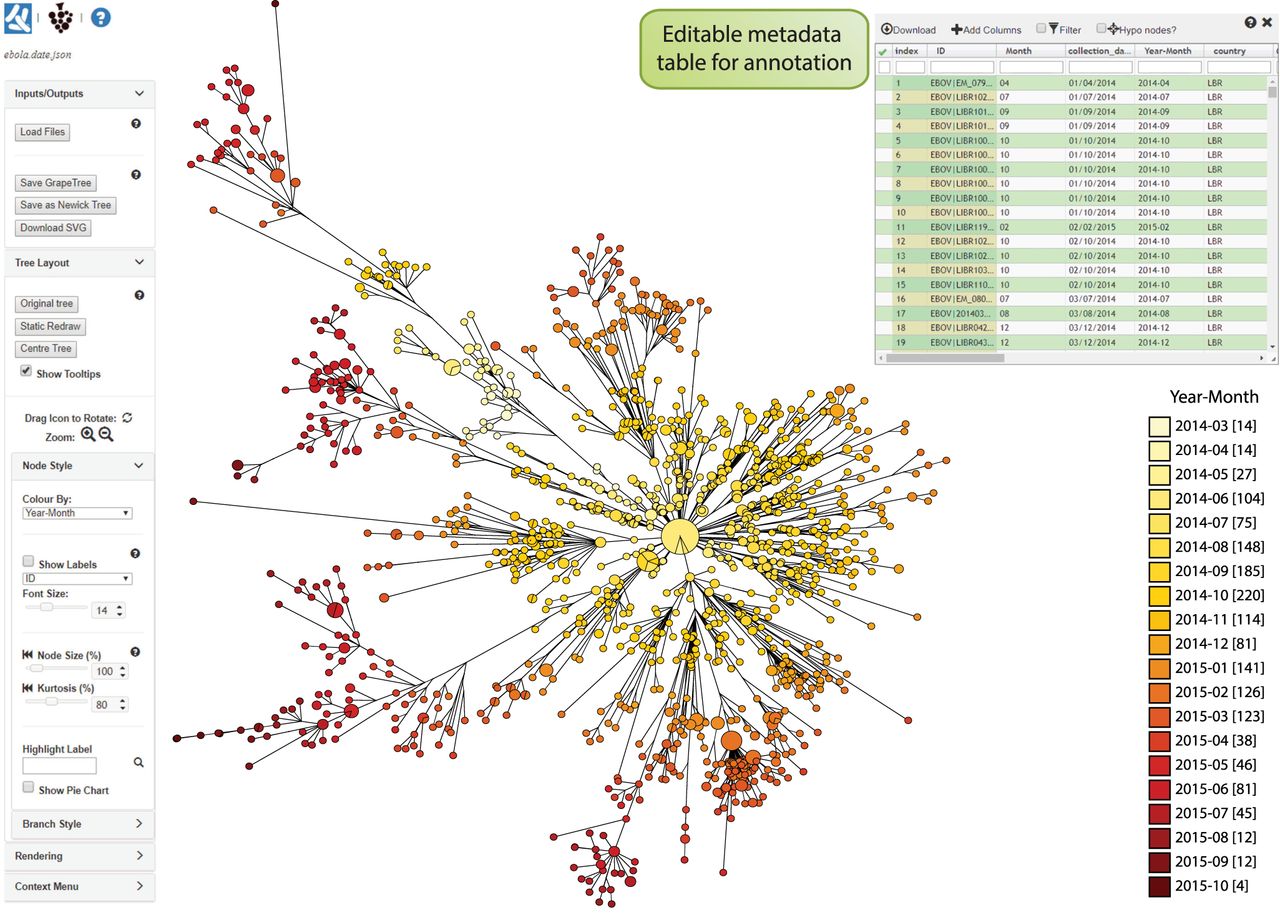
GrapeTree (SA) interface exemplified with a precalculated Newick tree based on 1610 Ebola genomes from the West African epidemic of 2013–2016. The tree and metadata were retrieved from microreact.org (https://microreact.org/project/west-african-ebola-epidemic), including a column designated “collection_date.” A new data column (year-month, upper right) was added to the metadata panel that contained the year and month information from “collection_date,” and this column was used to color-code the visualization as a temporal gradient (key, lower right). Branches spanning <0.22 substitutions per site were collapsed for clarity. The data indicate progressive radiation from a central source, consistent with published findings (http://www.nextstrain.org/ebola) (Dudas et al. 2017). An interactive version of this figure and metadata can be found at http://bit.ly/2EUkEKp.