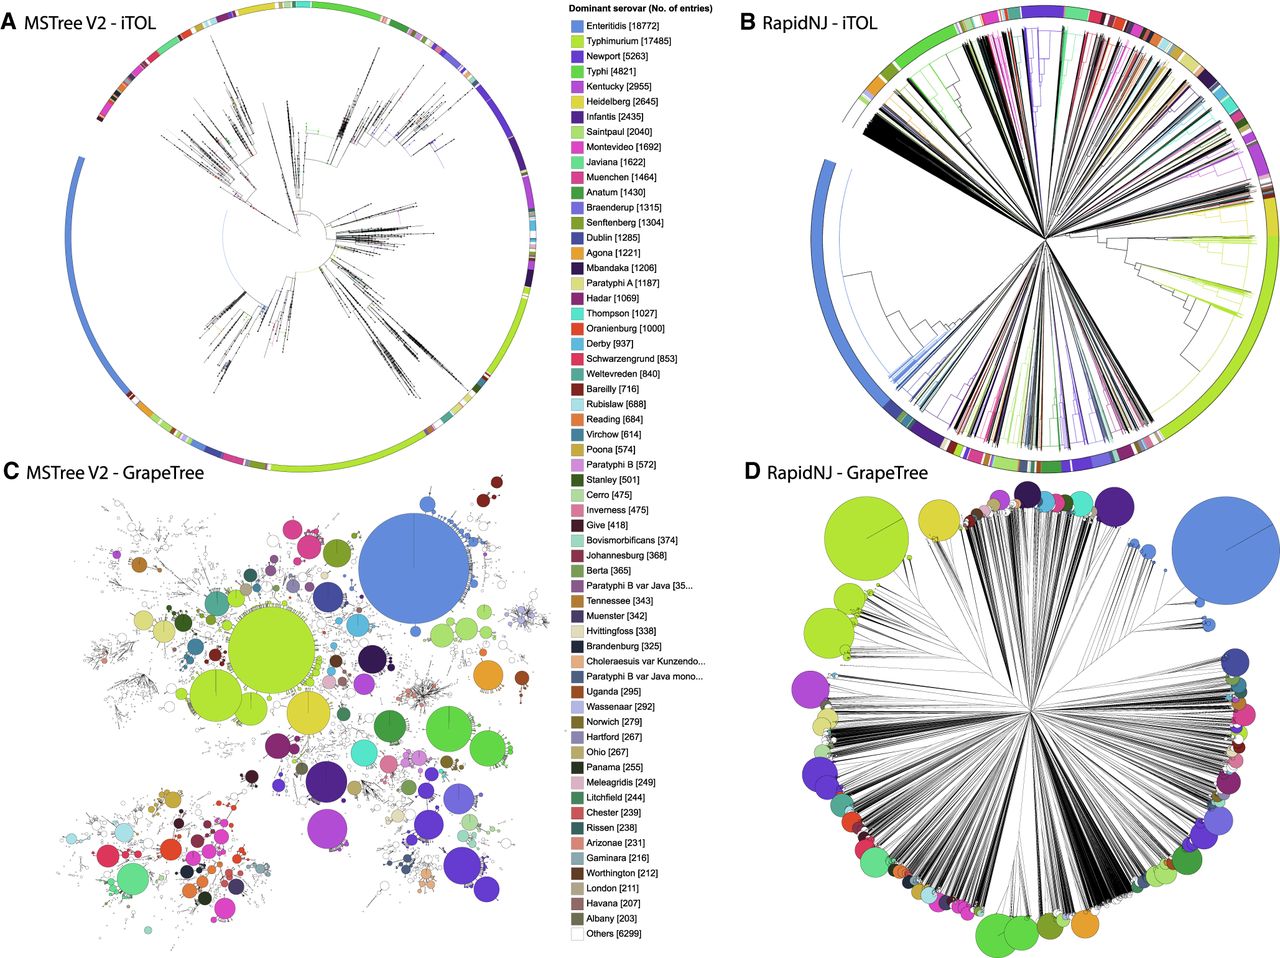
Visualization of 3902 legacy Salmonella MLST STs from 99,722 genomic assemblies in EnteroBase (Alikhan et al. 2018) by a phylogram versus a minimum spanning tree. (A,B) iTol (Letunic and Bork 2016) visualization of genetic relationships. Nodes at the ends of the terminal edges represent each of the 99,722 genomic assemblies. (C,D) GrapeTree visualization of genetic clusters. Nodes represent each of the 3902 STs, with diameters scaled to the number of assemblies. In C, edges between nodes mark allelic distances of 1–2 of the seven loci. (A,C) Representation of a minimum spanning tree generated by MSTree V2 in Newick format. (B,D) Representation of a neighbor-joining tree generated by RapidNJ (Simonsen et al. 2011) in Newick format. Color codes for the 60 most common serovars are indicated in the central key legend and used to color branches plus wedges in an external circle (A,B) or individual nodes (C,D). Interactive versions of the trees can be found at (A) http://bit.ly/2qH06jp, (B) https://bit.ly/2mDOpbS, (C) http://bit.ly/2H69dkG, and (D) https://bit.ly/2LG62Tl.