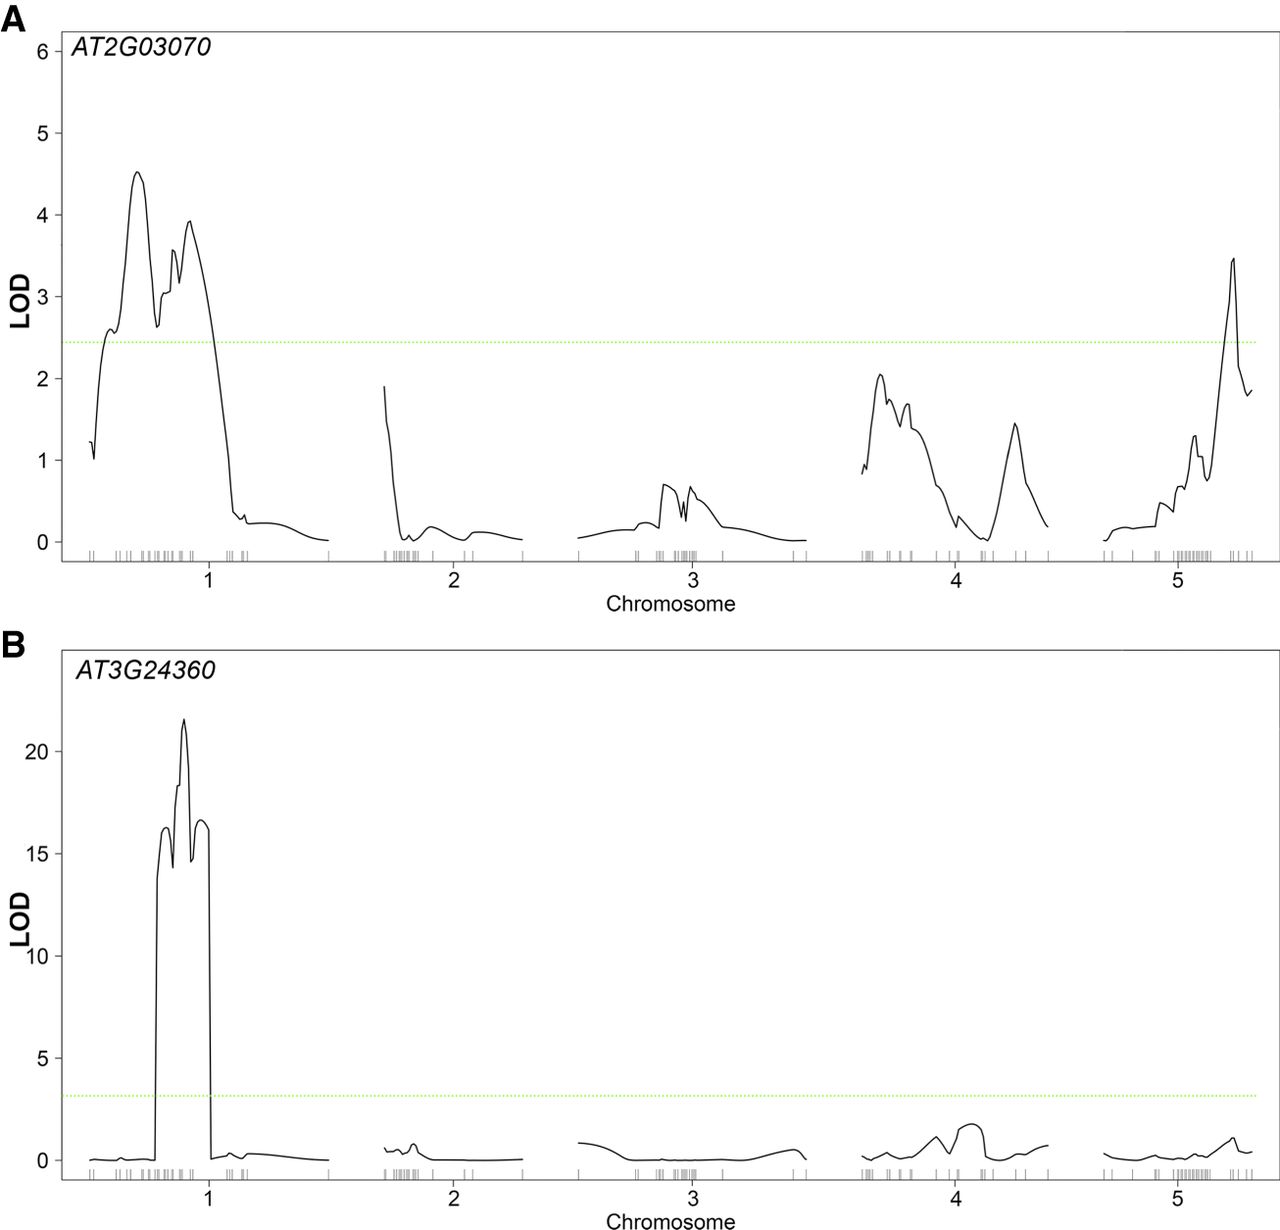
Figure 6.
Expression QTL analysis in epiRILs. (A) AT2G03070 and (B) AT3G24360. RNA was extracted for 93 epiRILs, reverse-transcribed to cDNA, and quantified by SYBR Green qPCR. Gene expression was normalized against the reference gene TIP41 and subjected to eQTLepi analyses. Green line indicates LOD significance threshold that was calculated using 1000 random permutations with α 0.05 as the genome-wide type 1 error level. Markers positions are indicated on the bottom of the graph.