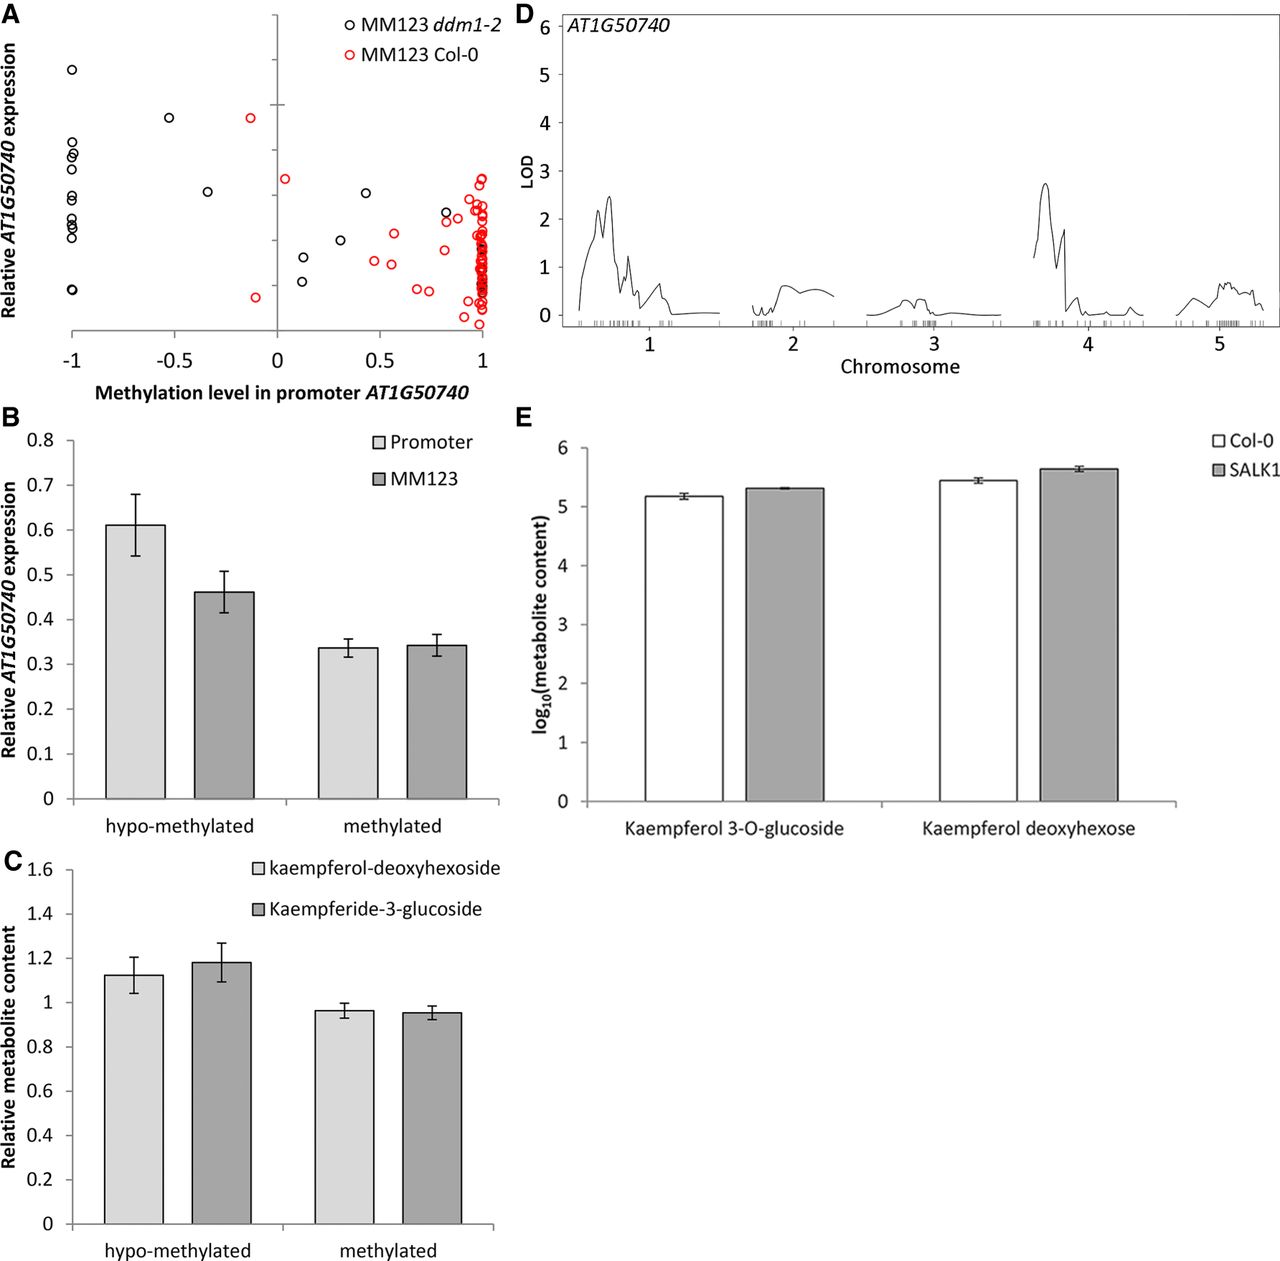
Confirmation analyses for AT1G50740. Methylation variation in the promoter of AT1G50740 is associated with variation in gene expression and metabolite content. (A) Scatterplot indicating the correlation between methylation at promoter and gene expression of AT1G50740 in all epiRILs. Red circles indicate epiRILs with wild-type allele at the DMR MM123; black circles indicate epiRILs with ddm1-2 allele at DMR MM123. (B) Histograms indicating the association of the methylation level at the promoter of AT1G50740 (light gray) and DMR MM123 (dark gray) with the relative gene expression of AT1G50740. (C) Histograms indicating the association of the methylation level at promoter of AT1G50740 with the relative metabolite content of kaempferol-deoxyhexoside (light gray) and kaempferide-3-glucoside (dark gray). Hypomethylated indicates a methylation level between −1 and −0.3; methylated indicates a methylation level between −0.3 and 1. (D) eQTLepi analysis for AT1G50740 in epiRILs. (E) Variation in metabolite content of kaempferol-3-O-glucoside and kaempferol deoxyhexoside in wild-type Col-0 and AT1G50740 knock-out mutant (designated SALK1 here; see Supplemental Material for details).