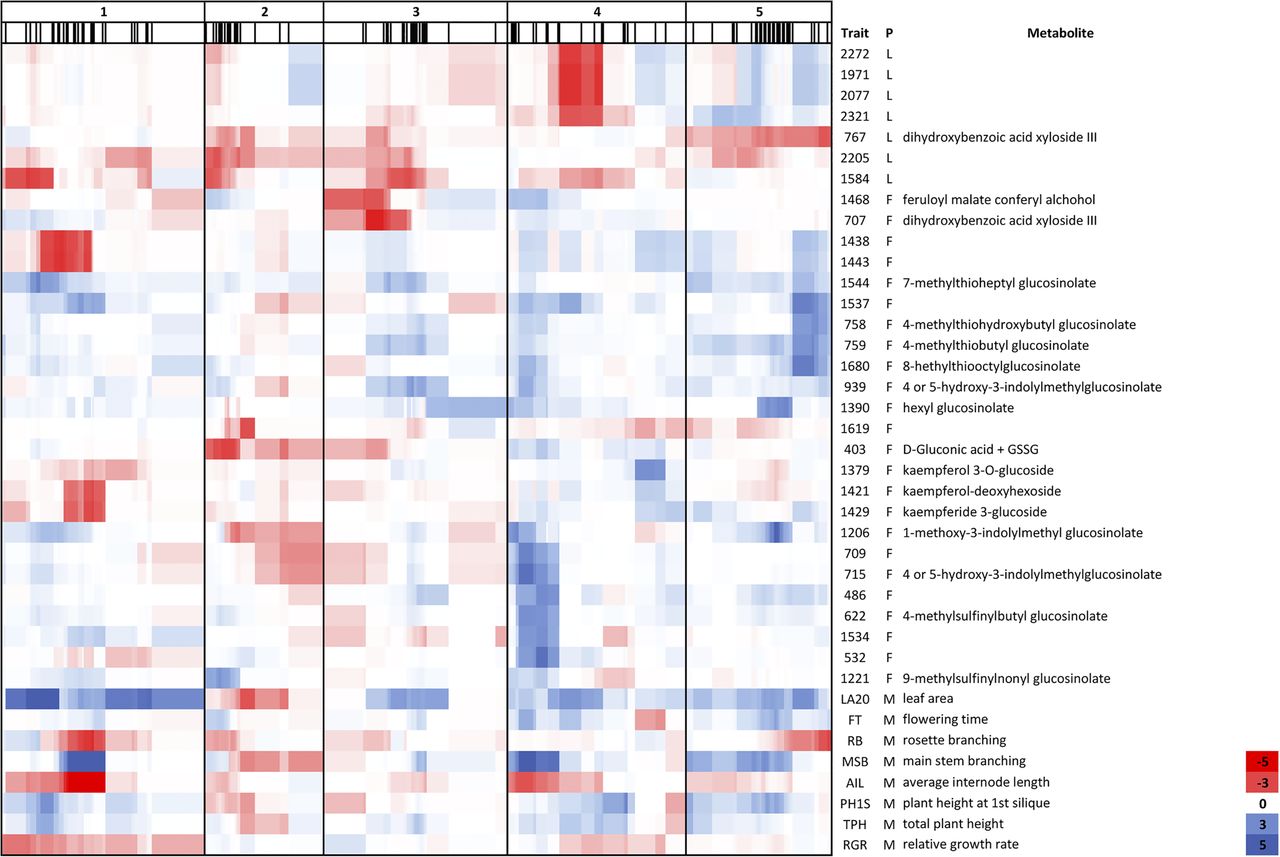
Figure 3.
QTLepi heat map for metabolic and morphological traits. QTLepi heat map showing the positions of the QTLepi and the overlap with QTLepi for morphological traits divided over the five chromosomes. The morphological traits were described previously (Kooke et al. 2015). The thin black lines in the second row indicate the marker positions in cM. (Trait) Metabolite number or morphological trait, (P) phenotype group, (L) leaf, (F) flower, (M) morphology. The legend on the right indicates the QTL LOD score between −5 (red) and 5 (blue).