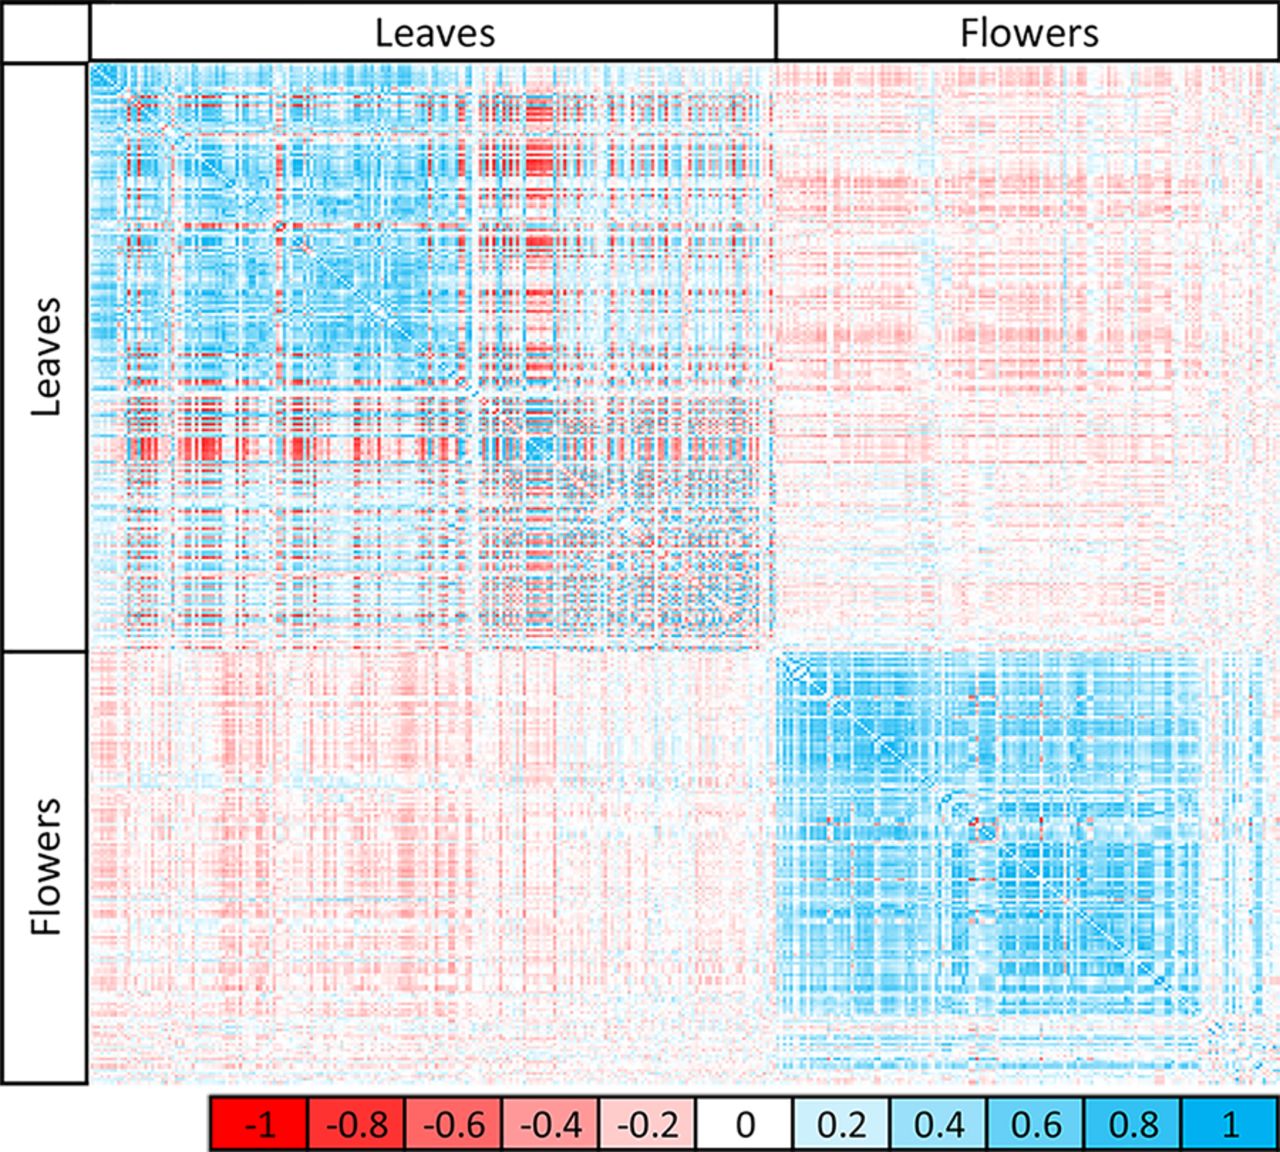
Figure 2.
Correlation matrix of detected metabolites in the epiRIL population. Pearson's correlation between metabolites within and between tissues is indicated by color intensity from −1 (red) to 1 (blue). Variation in metabolites correlates within the same tissue, but correlation between different tissues is much weaker.