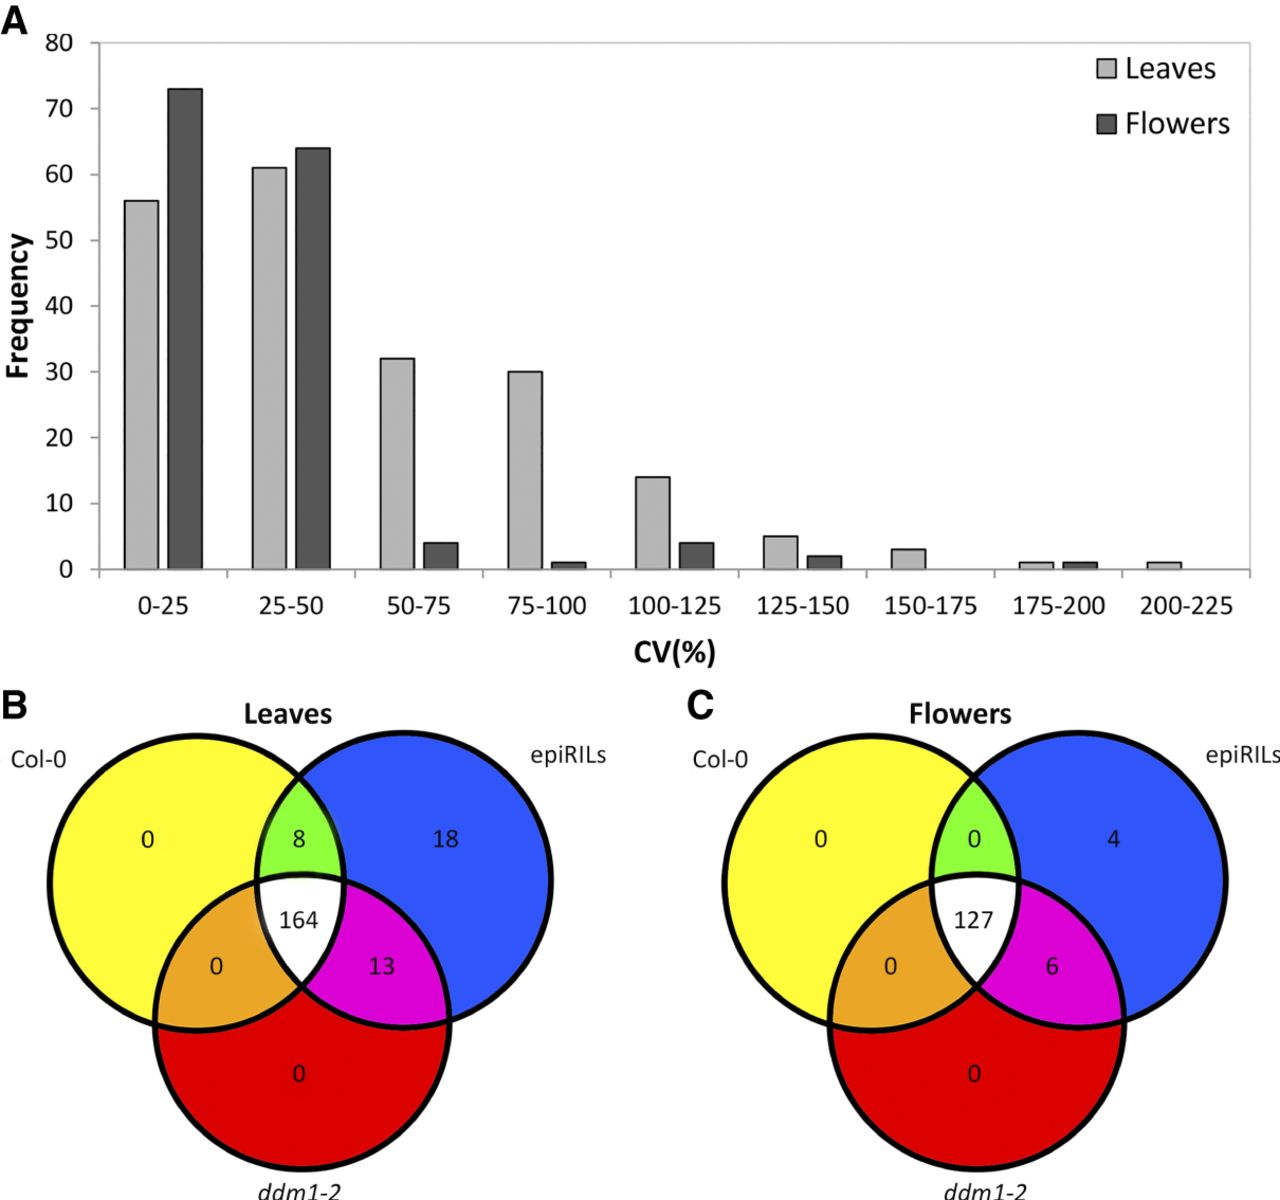
Figure 1.
Metabolite variation in leaves and flowers of epiRIL population. (A) Frequency distribution of coefficient of variation (%) for all 203 leaf (light gray) and 149 flower (dark gray) metabolites detected in the Col-0 × ddm1-2 epiRIL population using untargeted LC-QTOF-MS-based metabolomics. (B) Number of metabolites that were detected in the leaves of the parents of the population, Col-0 and ddm1-2, and the epiRILs. (C) Number of metabolites that were detected in the flowers of the parents of the population, Col-0 and ddm1-2, and the epiRILs.