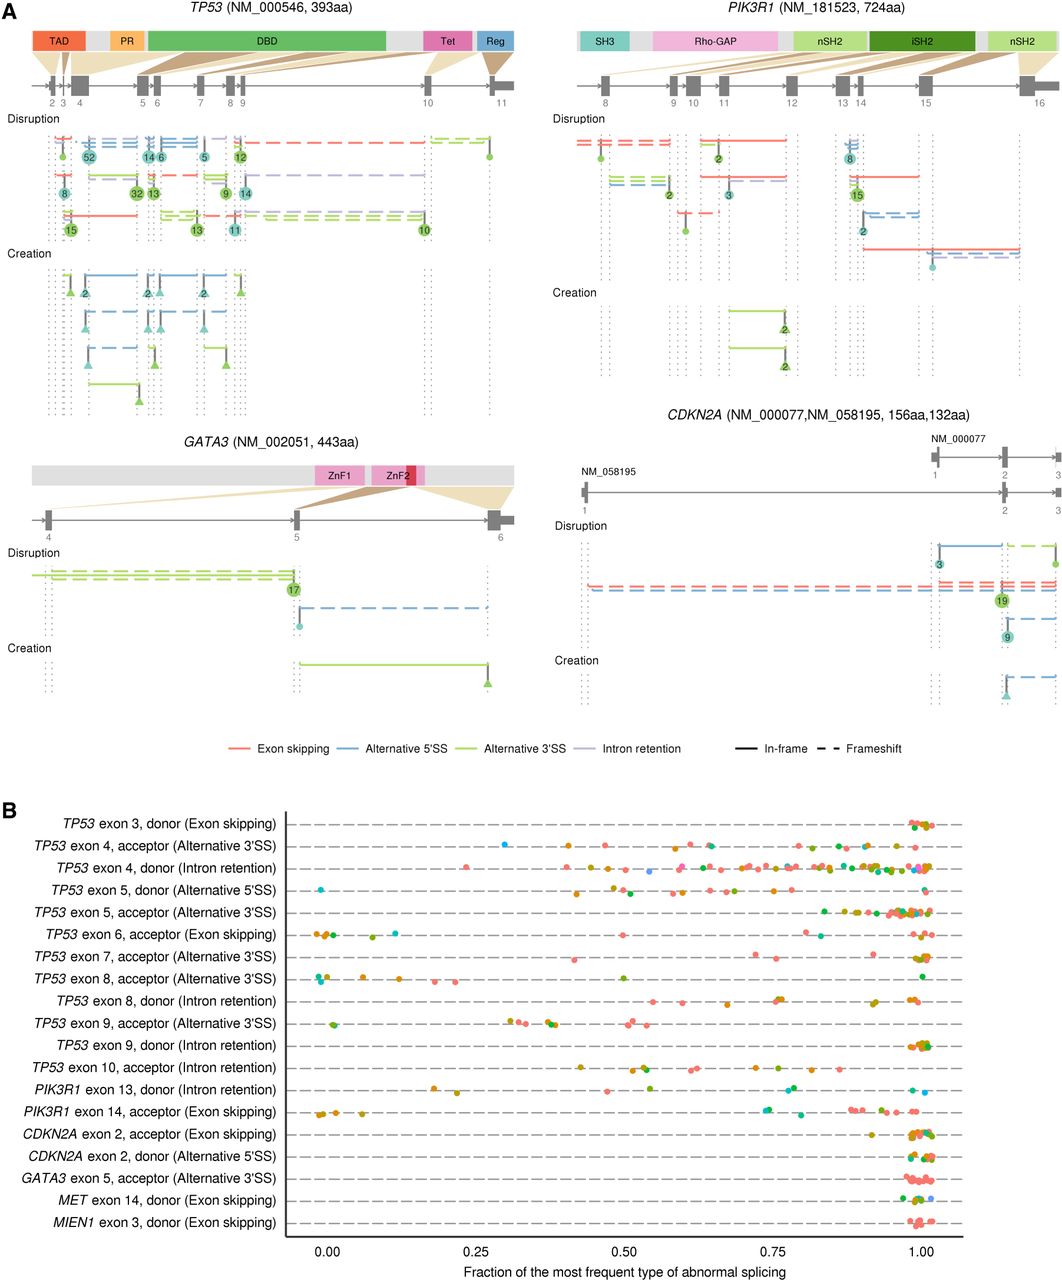
Genes frequently affected by SAVs in human cancers. (A) Distribution of SAVs and their resultant splicing outcomes for TP53 (upper left), PIK3R1 (upper right), GATA3 (lower left), and CDKN2A (lower right). SS-disrupting and SS-creating SAVs are aggregated according to the authentic and alternative SSs, respectively. The numbers in circles or triangles represent the number of SS-disrupting and SS-creating SAVs for each SS, respectively. See also Supplemental Figure S7A. (B) Fraction of the most frequent relative to total associated splicing outcomes for each SS-level SAV hotspot (found in ≥8 samples). The most frequent splicing outcome is noted in parentheses for each SS. The same color indicates the identical SAVs in terms of position and substitution or indel patterns. See also Supplemental Figure S7B.