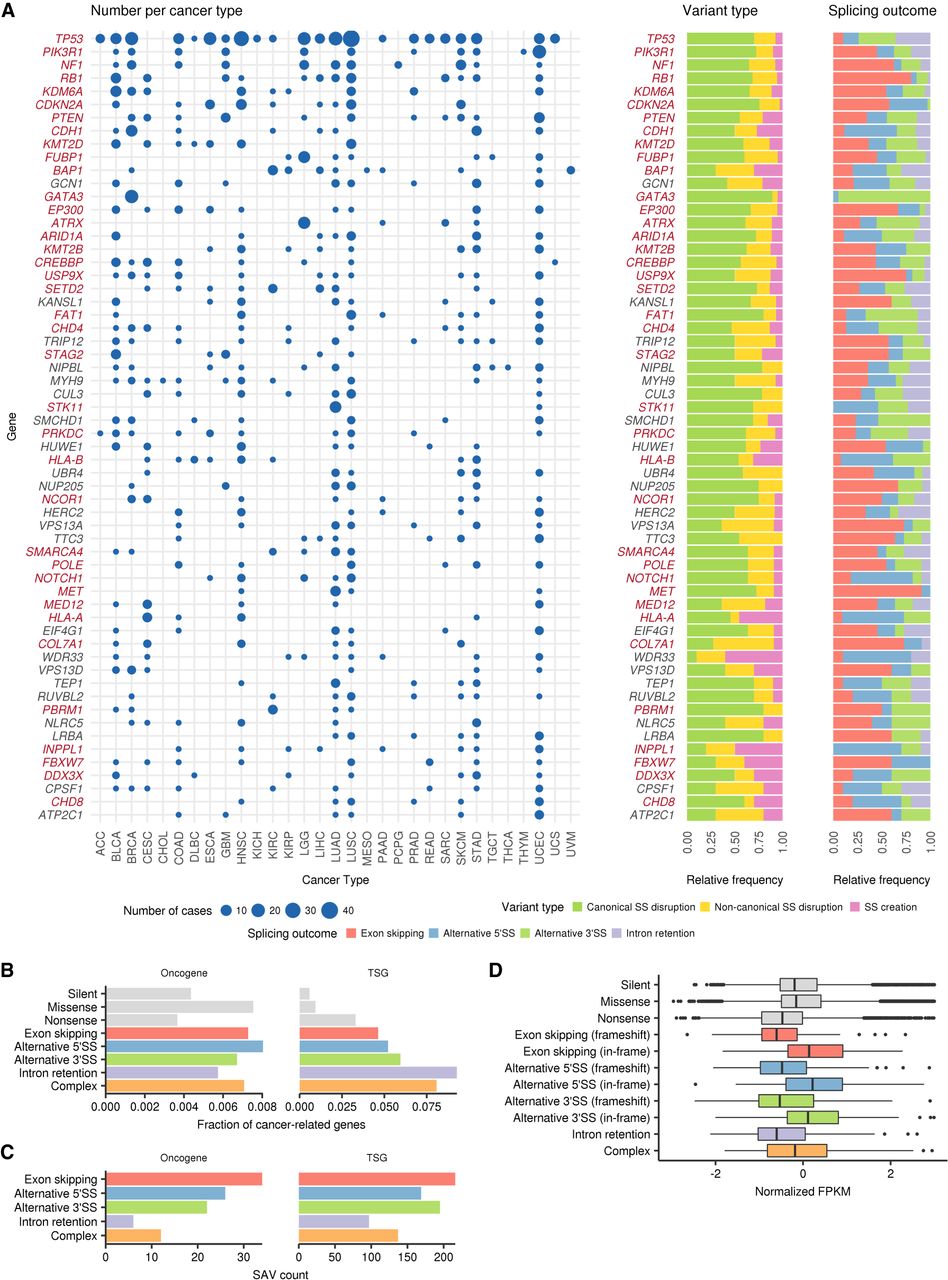
Entire spectrum of SAVs across cancer types. (A) Left: Landscape of SAVs in frequently altered genes (total number ≥10) across cancer types. The point size indicates the number of affected samples. Genes are sorted by the total number of SAVs in all cancer types, and known cancer-related genes (Ye et al. 2016) are shown in red. Right: Relative frequencies of variant types and splicing outcomes of SAVs. For SAVs causing multiple splicing alterations, splicing outcomes with the largest number of supporting reads are selected. (B) The fractions of SAVs affecting oncogenes or TSGs (based on Vogelstein et al. 2013) relative to total SAVs according to splicing outcomes were compared with other types of somatic variants (silent, missense, and nonsense). See also Supplemental Figure S6. (C) The number of SAVs affecting oncogenes or TSGs (based on Vogelstein et al. 2013). (D) Box plots showing changes in normalized (z-scored) mRNA expression (FPKM) for each splicing outcome, as compared to other types of somatic variants.