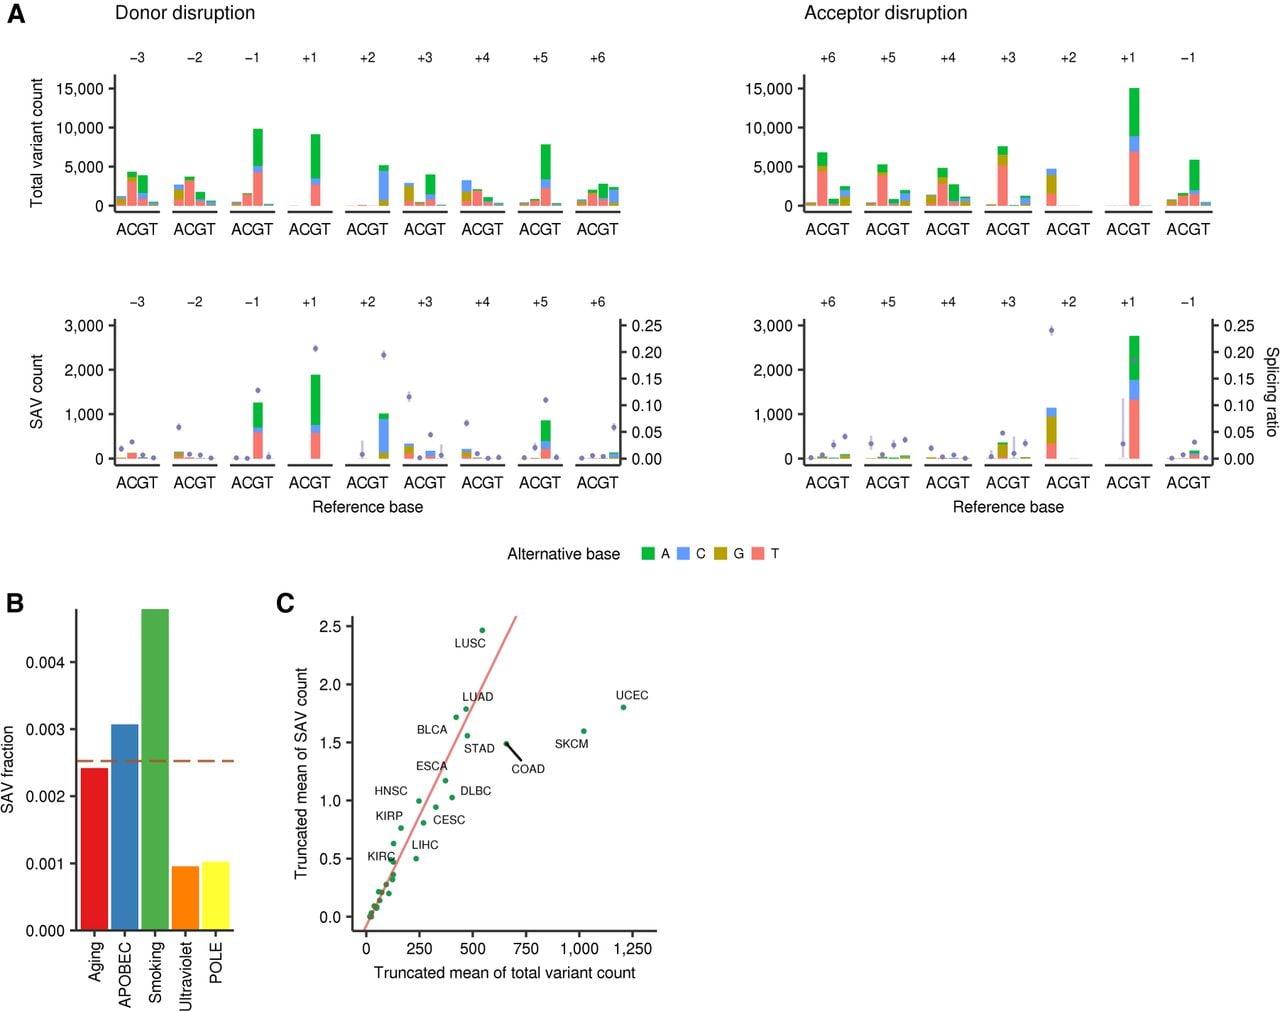
Mutational signatures underlying the generation of SS-disrupting SAVs. (A) Base substitution patterns of total somatic variants (upper) and SAVs (lower) at each exonic and intronic position of splice donor and acceptor sites. Different colors are used to display different types of alternative bases. The x-axes represent different reference bases, and the y-axes represent the numbers of variants. Fractions of SAVs relative to total somatic variants (purple points) with Bayesian confidence intervals (5% to 95% posterior quartiles) are also shown. (B) Fraction of estimated SAVs relative to estimated total variants attributed to each mutational signature. Red dashed line represents the overall fraction of SAVs relative to total variants. See also Supplemental Figure S5, A and B. (C) Scatter plot showing the relationship between SAV and total variant counts in 31 cancer types. A linear regression line (red) is fitted to the data points for each cancer, excluding those for COAD, SKCM, and UCEC. The truncated mean is used to exclude the samples with extremely large numbers of somatic variants. See also Supplemental Figure S5C–H.