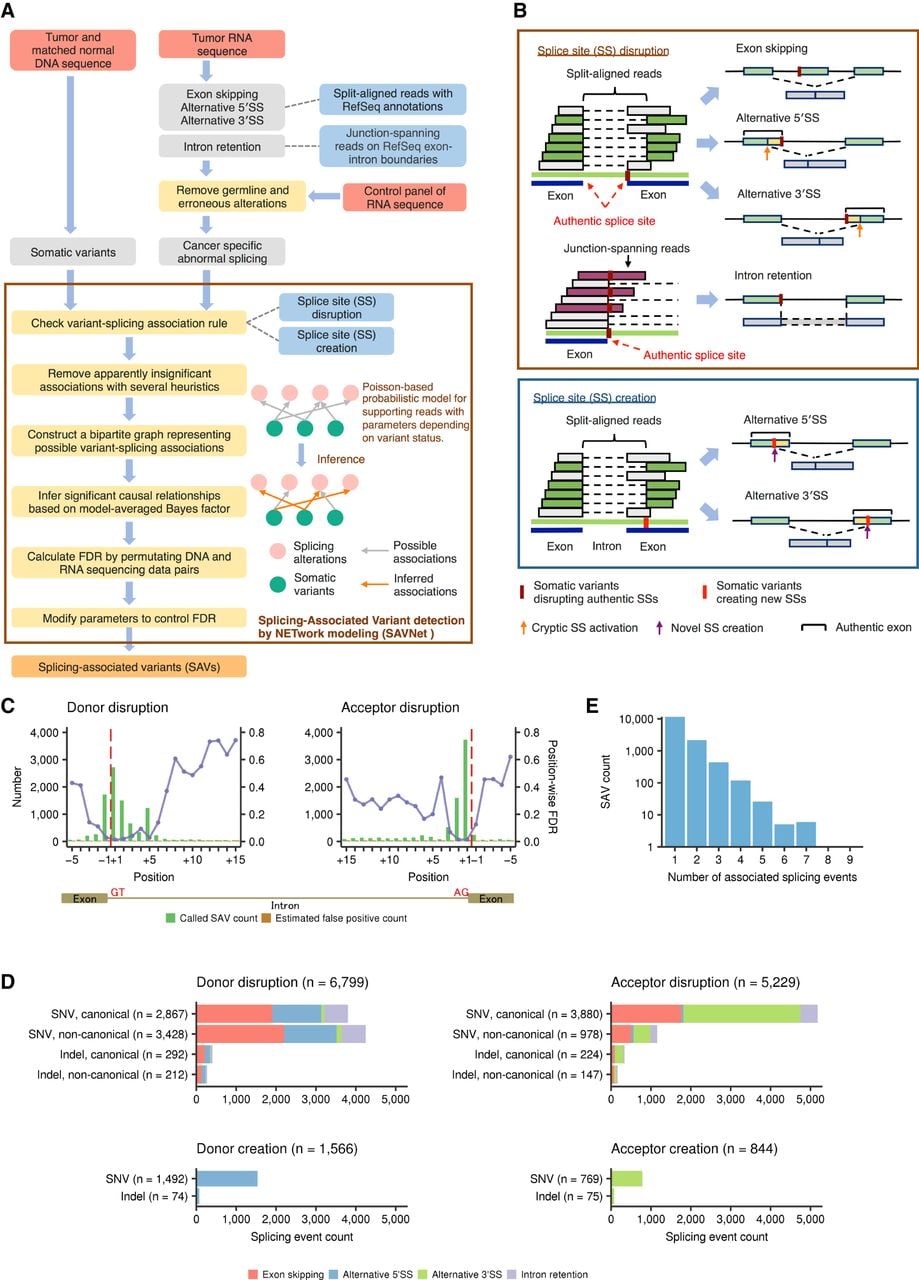
Workflow and evaluation of SAVNet and overview of SAVs. (A) Workflow for detecting SAVs by SAVNet from matched WES and RNA-seq data. (B) Schematics depicting quantification methods of exon skipping and alternative 5′ SS or 3′ SS usage (by split-aligned reads) and intron retention (by junction-spanning reads) and examples of somatic variants associated with abnormal splicing. SAVs within authentic SSs that disrupt normal splicing (SS disruption) and those outside authentic SSs that create alternative SSs (SS creation) were evaluated separately. (C) Evaluation of position-wise numbers of SAVs (green) and estimated false positives (brown) between the fifth exonic base (−5) and the 15th intronic base (+15) for splicing donor and acceptor sites. Purple points with lines show estimated position-wise FDRs. Red dashed lines represent exon-intron boundaries. (D) Number of each type of abnormal splicing events for each SAV type, stratified by (1) donor or acceptor, (2) disruption or creation, (3) SNVs or indels, and (4) canonical or noncanonical sites. Numbers in parentheses indicate the number of each type of SAV. (E) Histogram of the number of SAVs according to the number of associated abnormal splicing events. See also Supplemental Figures S1 and S2, A and B.