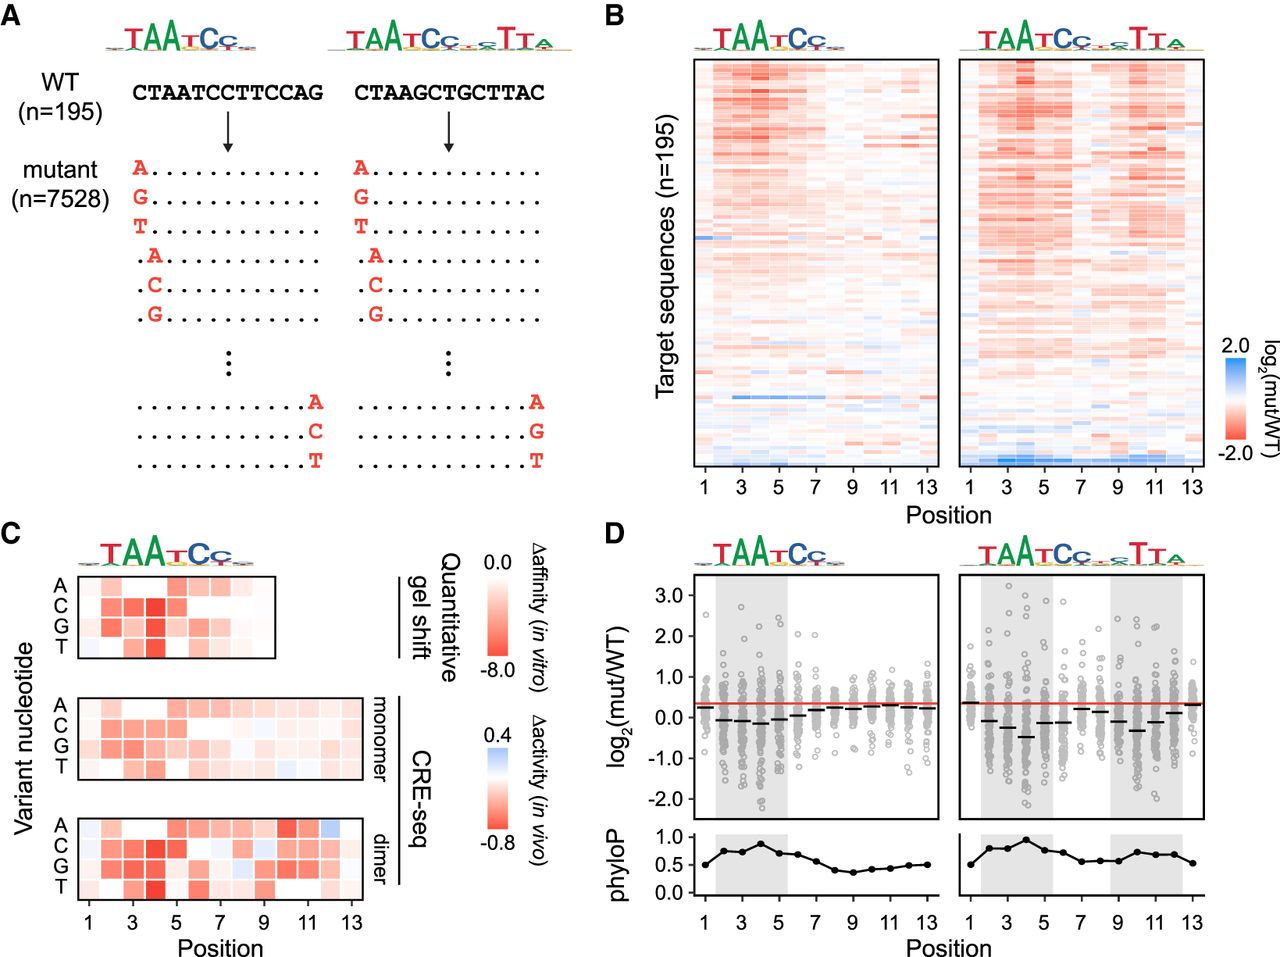
Dense mutagenesis of monomeric and dimeric CRX binding sites. (A) Schematic of experimental approach. All single-nucleotide substitutions in a 13-bp window overlapping 97 monomeric and 98 dimeric CRX binding sites were quantified by CRE-seq (n = 39 mutations per TF binding site). (B) Heatmaps of median effects (across all three substitutions) at each position (columns) in each targeted CRX binding site (rows). Each heatmap represents 97 or 98 distinct elements, and rows are sorted by wild-type activity (high to low). (C) Heatmaps of median effects (across all target sites) at each position (columns) for specific substitutions (rows). (Top) Change in CRX binding site affinity determined by quantitative gel shift for all possible substitutions in a single target sequence (Lee et al. 2010). (Middle) Change in activity determined by CRE-seq for substitutions in 97 monomeric CRX binding sites. (Bottom) Change in activity determined by CRE-seq for substitutions in 98 dimeric CRX binding sites. (D, top) Scatter plot of median effects (for all three substitutions; y-axis) at each position (x-axis) in each targeted CRX binding site. Points represent different targeted CRX binding sites, and horizontal bars represent the median across all targets. (Bottom) Average conservation scores (phyloP) at each position (same data as in Fig. 3A).