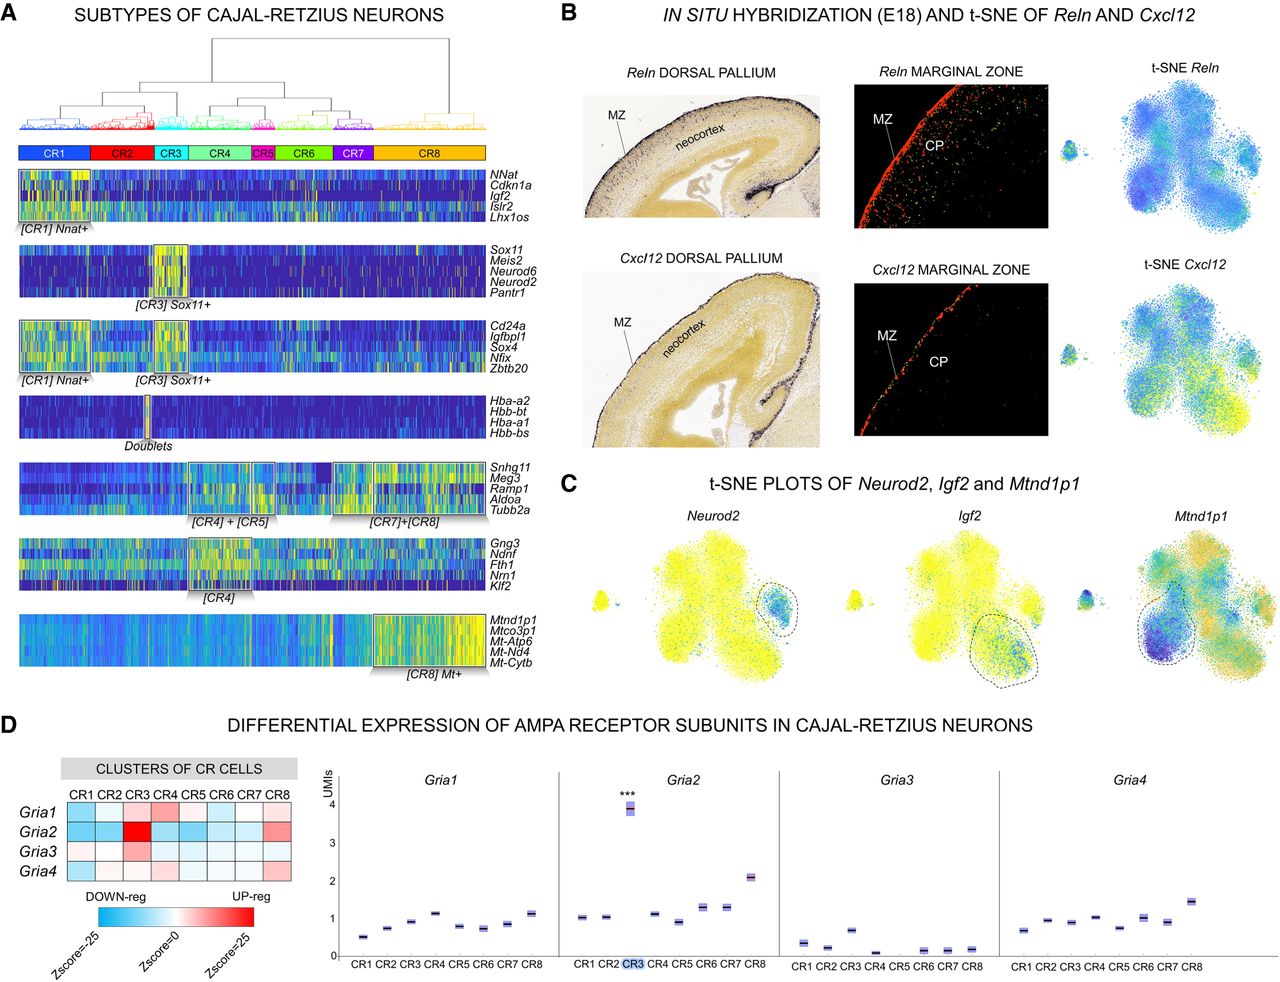
Subtypes of Cajal-Retzius (CR) cells disentangled by bigSCale. (A) Dendrogram and heatmap of the five top-scoring population markers (CR1–8; high expression, yellow; low expression, blue). (B) Comparison of Reln (top) and Cxcl12 (bottom) expression spatially resolved (in situ immunostaining [left] and fluorescence-staining [center]; source Allen Brain Atlas: Mouse Brain). Reln consistently marks all CR cells (t-SNE; right) located in the MZ and the CP. Cxcl12 is expressed in a CR subpopulation and in situ experiments indicate that Cxcl12-positive cells are exclusively located in the MZ. (C) t-SNE representation of Neurod2-positive, Igf2-positive, and Mt-nd1–positive subpopulations of CR cells. (D) DE of AMPA receptor subunits in CR cells. (Left) Heatmap (Z-scores) representing the relative expression level of each AMPA subunit in the CR subpopulations. (Red) Higher expression; (blue) lower expression. (Right) Expression of AMPA receptors displayed by UMI counts (y-axis). Significant DE is indicated; (***) Z-score > 10.