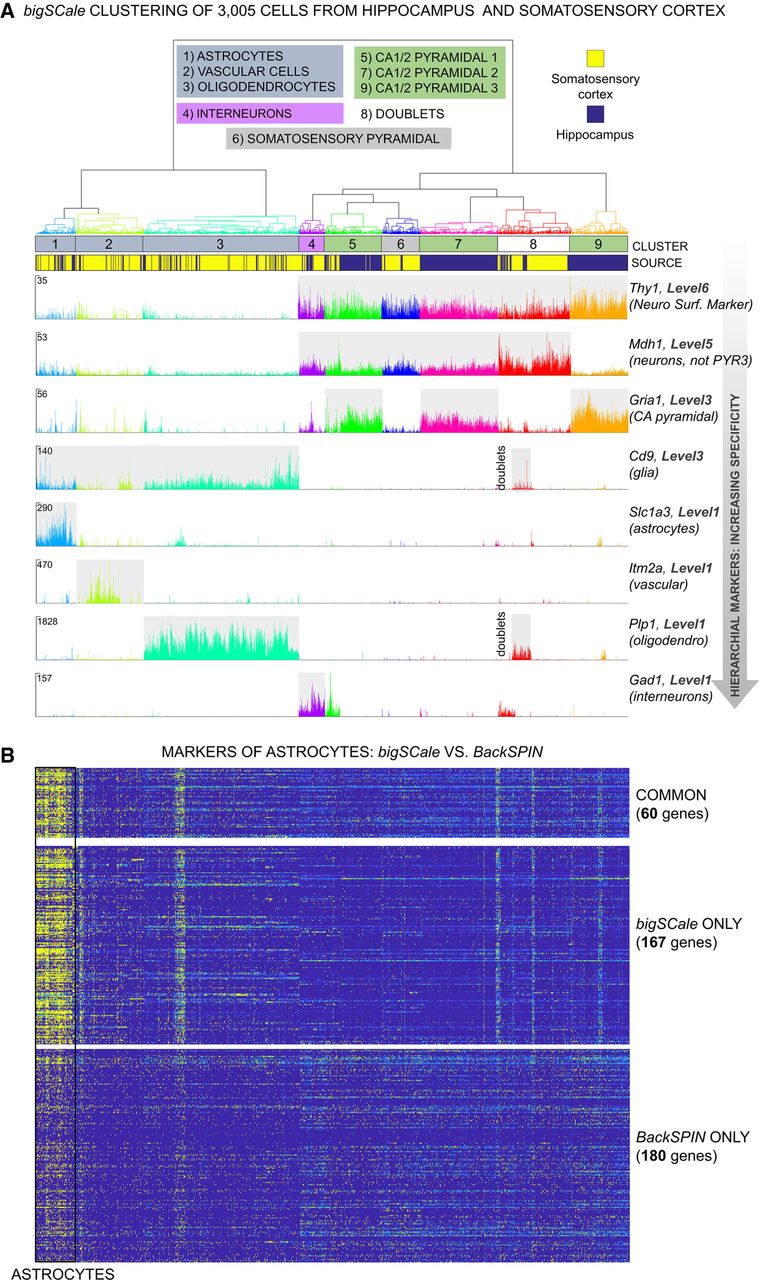
bigSCale analysis of scRNA-seq data from 3005 mouse cortical and hippocampal cells (Zeisel et al. 2015). (A) Dendrogram and expression plots reporting examples of hierarchical markers. Dendrogram was cut at 20% of its total depth to segregate nine different clusters of cells, which correspond to the main brain cell types. In the expression plots, UMI counts are shown at single-cell level for markers of different hierarchical marker levels (Methods). Marker genes for decreasing marker levels, representing distinct brain cell types are displayed. (B) Comparison of bigSCale and BackSPIN (Zeisel et al. 2015) in the detection of gene markers for astrocytes. bigSCale identified 167 additional markers with high specificity for astrocytes (high expression, yellow; low expression, blue). Vice versa, markers uniquely identified by BackSPIN display a weak specificity and achieved low scoring in bigSCale.