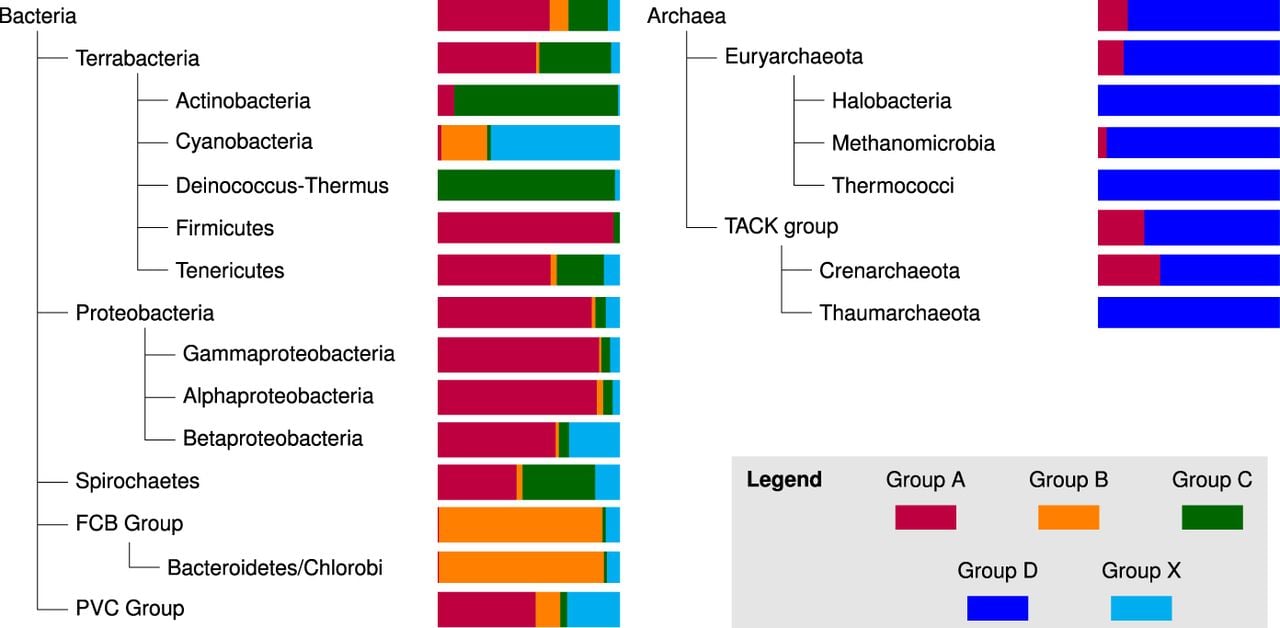
Figure 4.
Color-coded scheme of the distribution of groups A–D and X among ∼5000 representative genomes. The diagram shows the top three levels of the taxonomy trees of both archaea and bacteria.
Color-coded scheme of the distribution of groups A–D and X among ∼5000 representative genomes. The diagram shows the top three levels of the taxonomy trees of both archaea and bacteria.