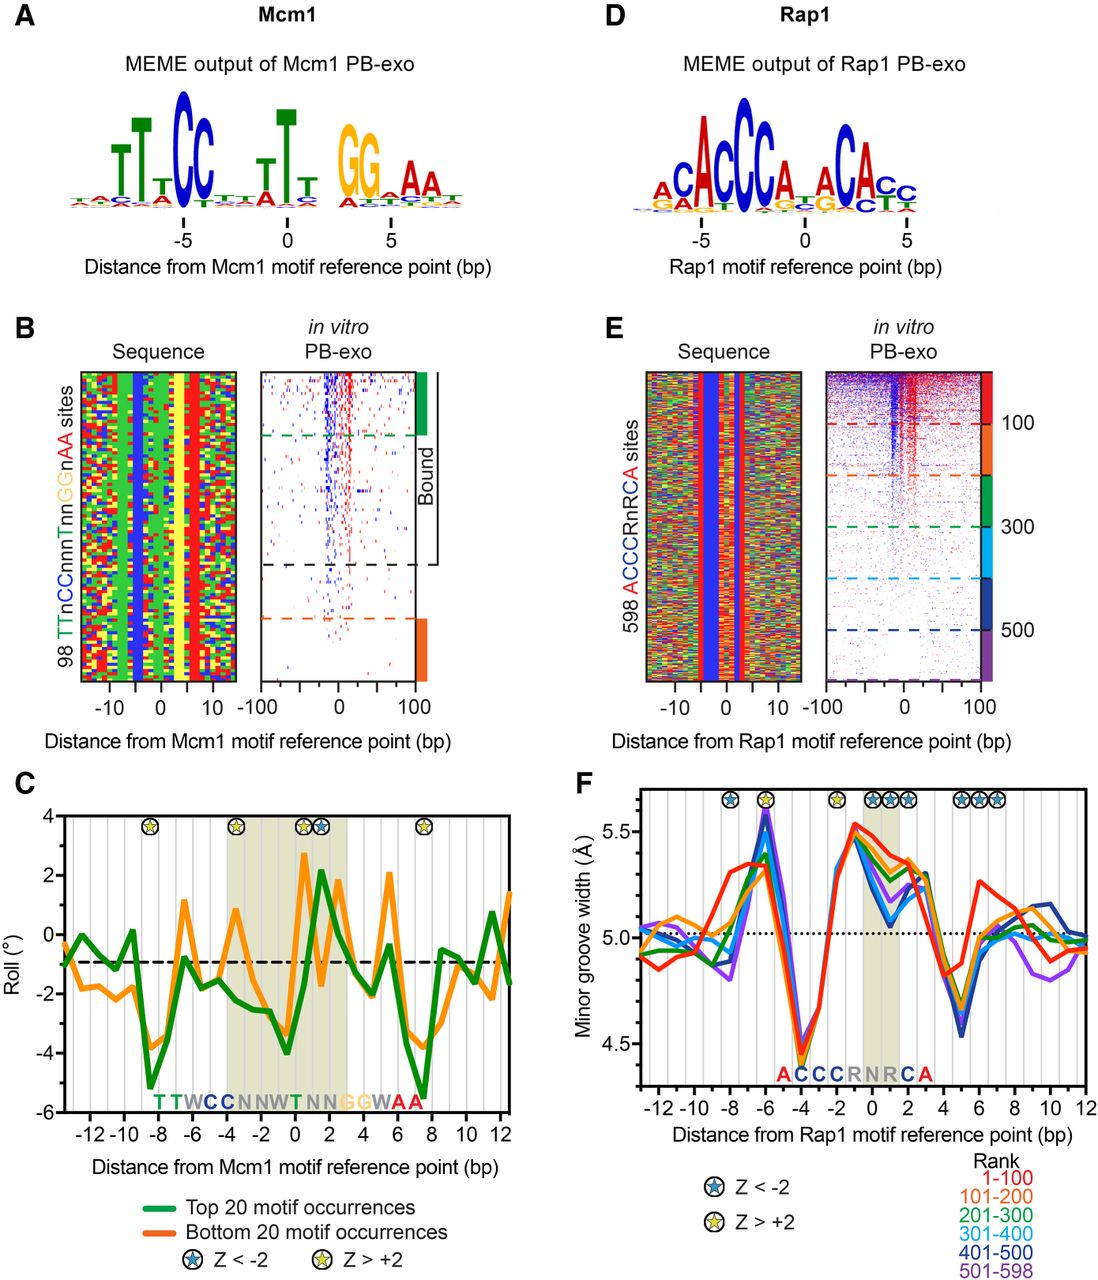
Influence of DNA shape on Mcm1/DNA and Rap1/DNA complex formation. (A) MEME logo obtained from the top 500 peak-pairs from Mcm1 PB-exo. (B, left panel) Four-color plot of sequences centered on the motif midpoint for all combined instances of TTnCCnnnTnnGGnAA in promoters or ORFs. (Right panel) Heat map of tags sorted by PB-exo. Sites above the black dashed line contain a peak pair. (C) Line plots of variations in roll for the top (green) versus bottom 20 (orange) motif occurrences. The dashed black line indicates the median roll of all DNA sequences. Blue and yellow stars represent positions with significant positive and negative roll (|Z| > 2, Mann-Whitney U test), respectively, for the top compared to the bottom sites. The position of the consensus Mcm1 motif is labeled along the x-axis. The tan shaded area indicates the nucleotides in the motif center that are bent in the structure presented in Supplemental Fig. S9A. (D) MEME logo obtained from the top 500 peak-pairs from Rap1 PB-exo. (E, left panel) Four-color plot of sequences centered on the motif midpoint for all combined instances of ACCCRnRCA in promoters or ORFs. (Right panel) Heat map of tags sorted by PB-exo. The dashed lines represent groups of 100 sites. (F) Line plots of variations in minor groove width for groups of 100 motif occurrences. Colored lines correspond to groups in E. The dashed black line indicates the genome-wide median. The position of the consensus Rap1 motif is labeled along the x-axis. Relevant shape effects are highlighted by shaded area. Blue and yellow stars represent positions with significant large or small minor groove width (|Z| > 2, Mann-Whitney U test), respectively, for the top 100 sites compared to the set of sites ranked 301–400 (light blue).