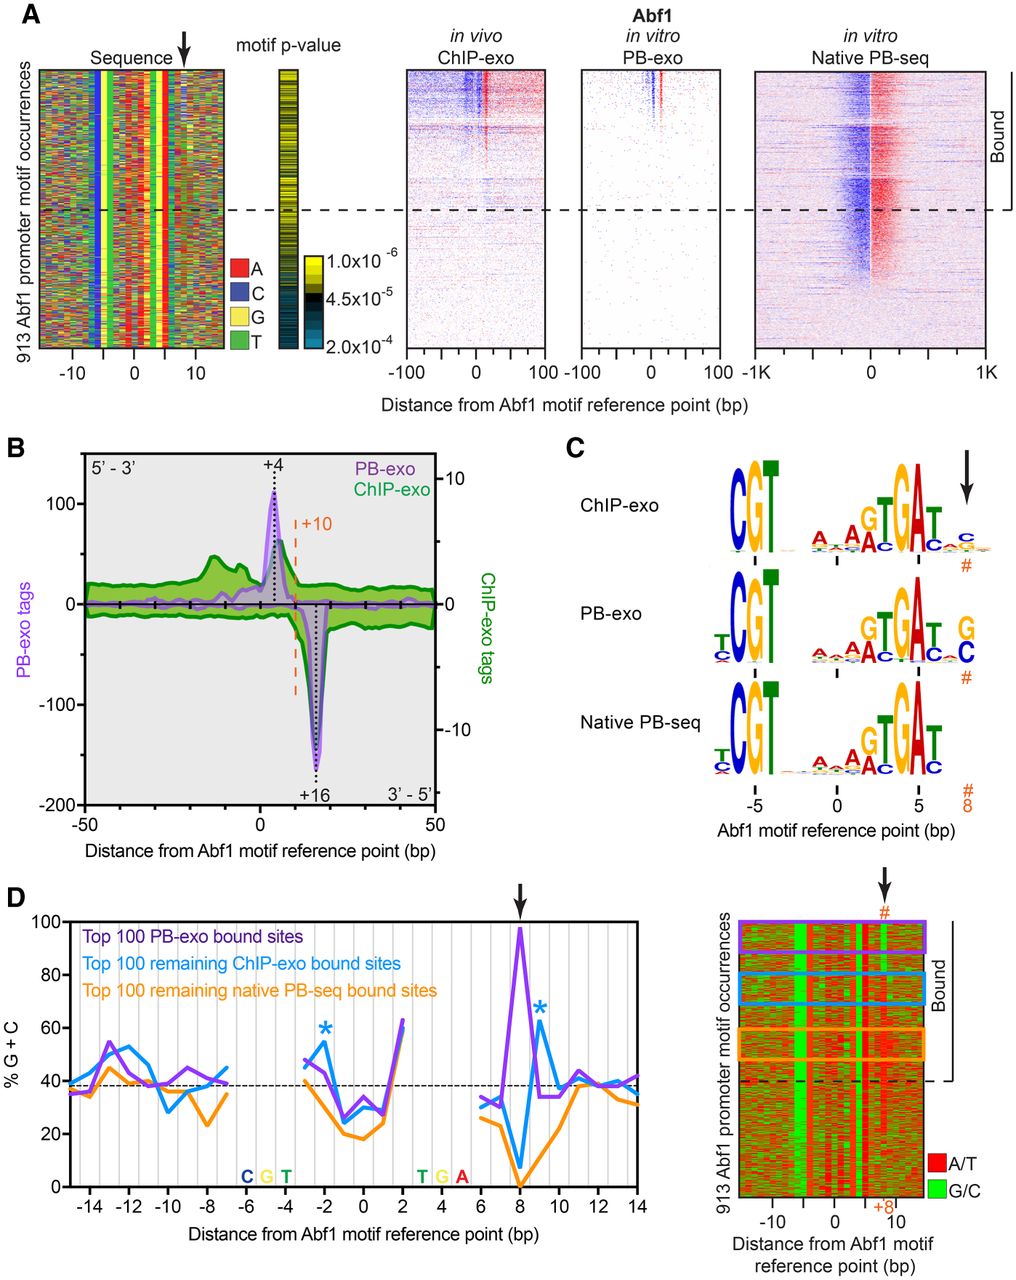
Genome-wide in vitro Abf1 binding reveals formaldehyde G/C specificity. (A) The left panel shows a four-color plot representation of 30-bp sequences centered on the motif midpoint. Each row represents a motif occurrence that passed our FIMO threshold. The black arrow points to the calculated cross-linking point. The remaining panels show, for each assay, tag 5′ ends distributed around motif occurrences located in promoters and sorted first by PB-exo, then ChIP-exo, and finally native PB-seq tag counts. Rows are linked across all data sets. The horizontal dashed line demarcates our threshold for binding in at least one assay. Sites with tags below the dashed line were not considered bound, because the tags generally did not form peak pairs or were not particularly enriched above background. (B) Tag counts for ChIP-exo (green) and PB-exo (purple) for Abf1 at Abf1 motif occurrences. (C) MEME logos obtained from the top 500 peak-pairs from each assay. The orange hashtag represents the calculated cross-linking point. (D) Left panel, frequency of G/C within 30-bp sequences centered on the Abf1 motif midpoint for the top 100 sites bound in PB-exo (purple), the top 100 remaining sites bound in ChIP-exo but not PB-exo (blue), and the top 100 remaining sites bound in native PB-seq but not the other two assays (orange). Blue asterisks highlight alternate cross-linking sites observed in ChIP-exo. Frequencies occurring within the Abf1 motif were not plotted. The dashed black line indicates the background G/C content. Right panel, four-color plot representation of A/T (red) or G/C (green) for sequences centered on the motif reference point. Colored boxes represent groups used in the left panel.