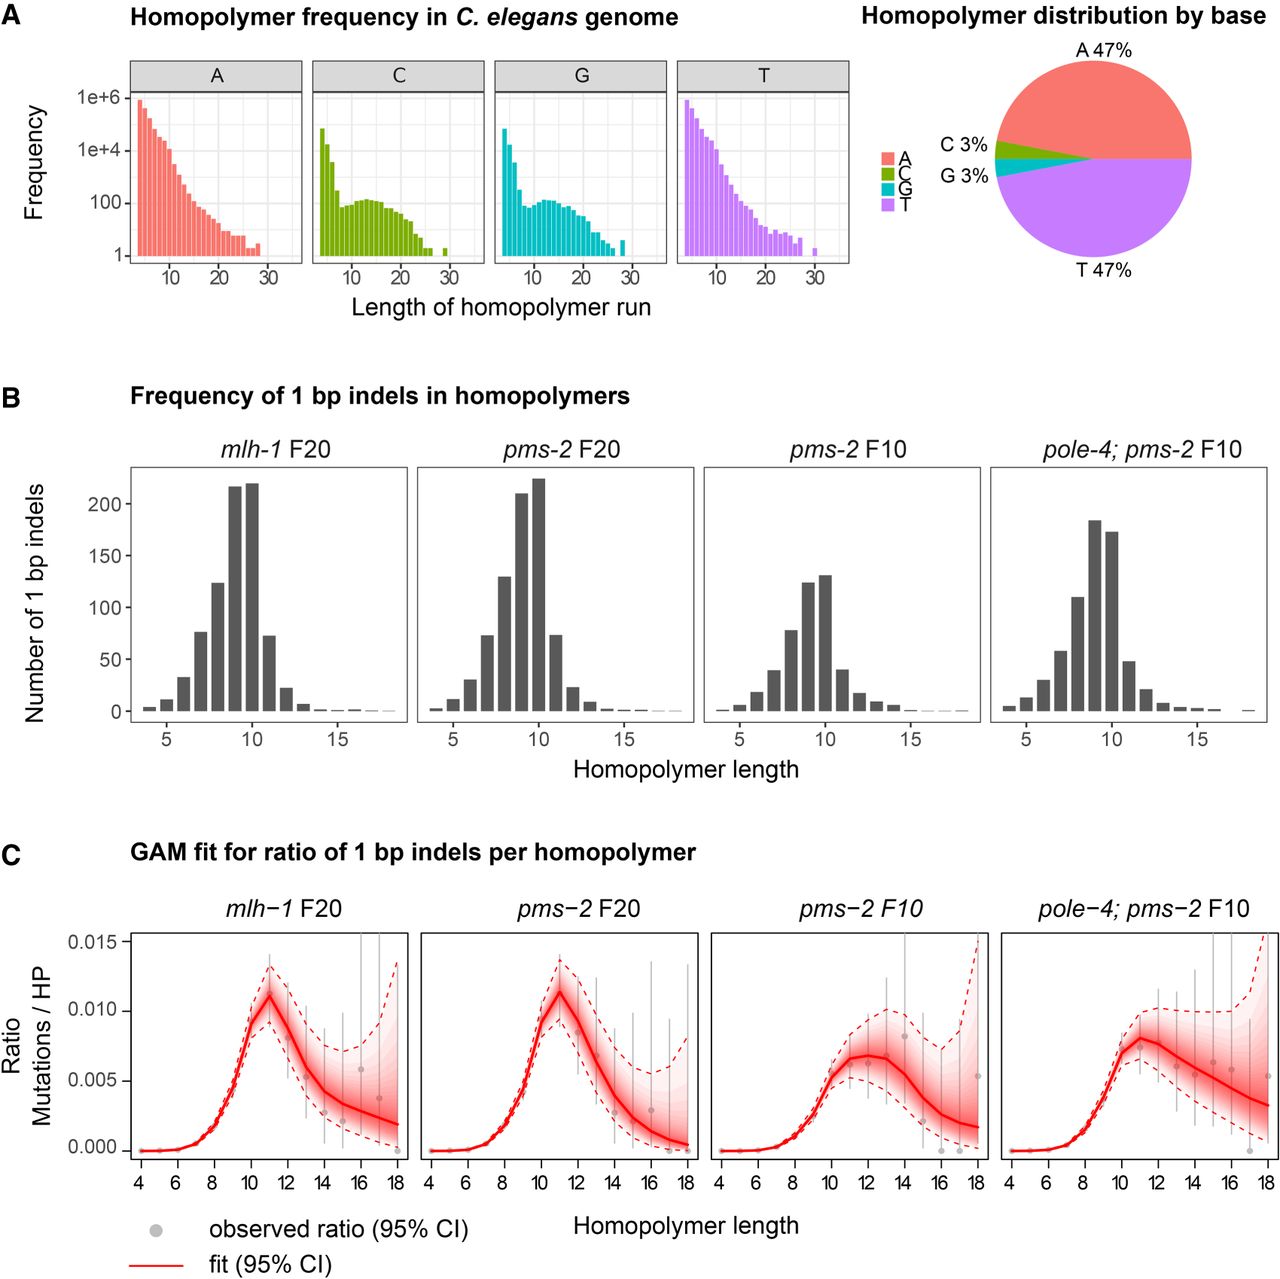
Correlation between homopolymer length and the frequency of +1/−1 bp indels. (A) Distribution of homopolymer repeats encoded in the C. elegans genome by length and DNA base shown in log10 scale (left) and the relative percentage of A, C, G, and T homopolymers in the genome (right). (B) Average number of 1-bp indels in homopolymer runs for mlh-1 F20, pms-2 F20, pms-2 F10, and pole-4; pms-2 F10 mutant lines by homopolymer length. (C) Generalized additive spline model (GAM) fit for the ratio of 1-bp indels normalized to the frequency of homopolymers (HPs) in the genome. The average frequency observed across three lines is depicted as a gray dot; gray bars indicate the 95% confidence interval. The red line indicates best fit. Red dotted lines represent the corresponding 95% confidence interval.