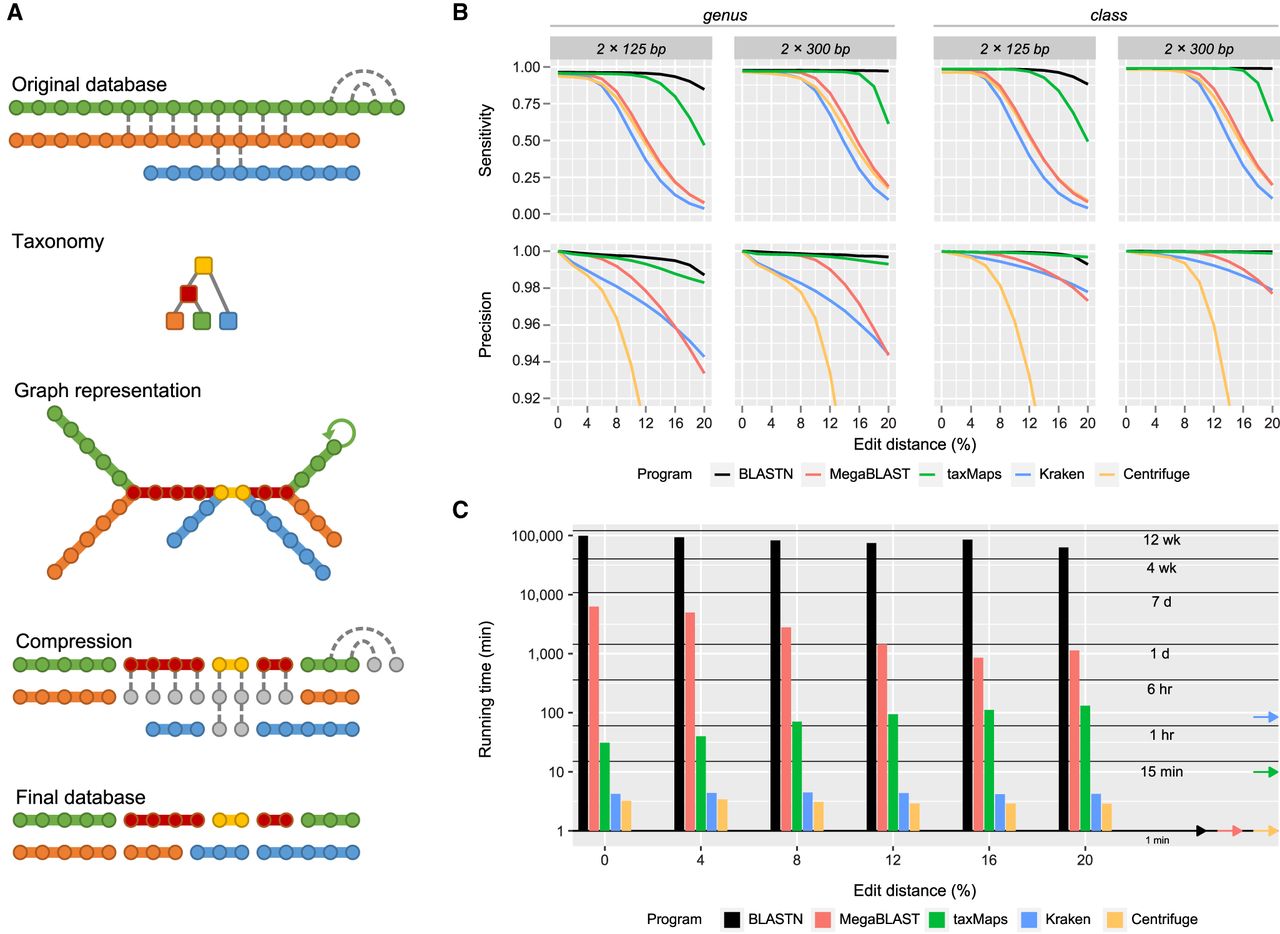
Database compression and classification accuracy and performance on simulated metagenomics paired-end data sets. (A) Visual representation of the taxMaps database compression algorithm. Each sequence is represented as an array of k-mers (circles), colored according to their taxon (colored squares). Identical k-mers are linked by a dashed line. During compression, the first instance of every k-mer is reclassified to the Lowest Common Ancestor of all instances of that k-mer in the database, while the remaining (gray circles) are disregarded. New sequences, composed of k-mers that share the same taxonomic classification, are assembled on the fly as the algorithm traverses the database. A graph representation of the database is also shown. (B) Classification sensitivity and precision as a function of average sequence divergence and read length at the genus and class ranks. For visualization purposes, Centrifuge's precision series have been truncated. For complete results, see Supplemental Figure S3. (C) Wall clock time required for the classification of six different data sets, each consisting of 10 million read pairs of 125 bp of length, depending on average sequence divergence. The arrows on the right indicate the database loading time for each program.