Figure 7
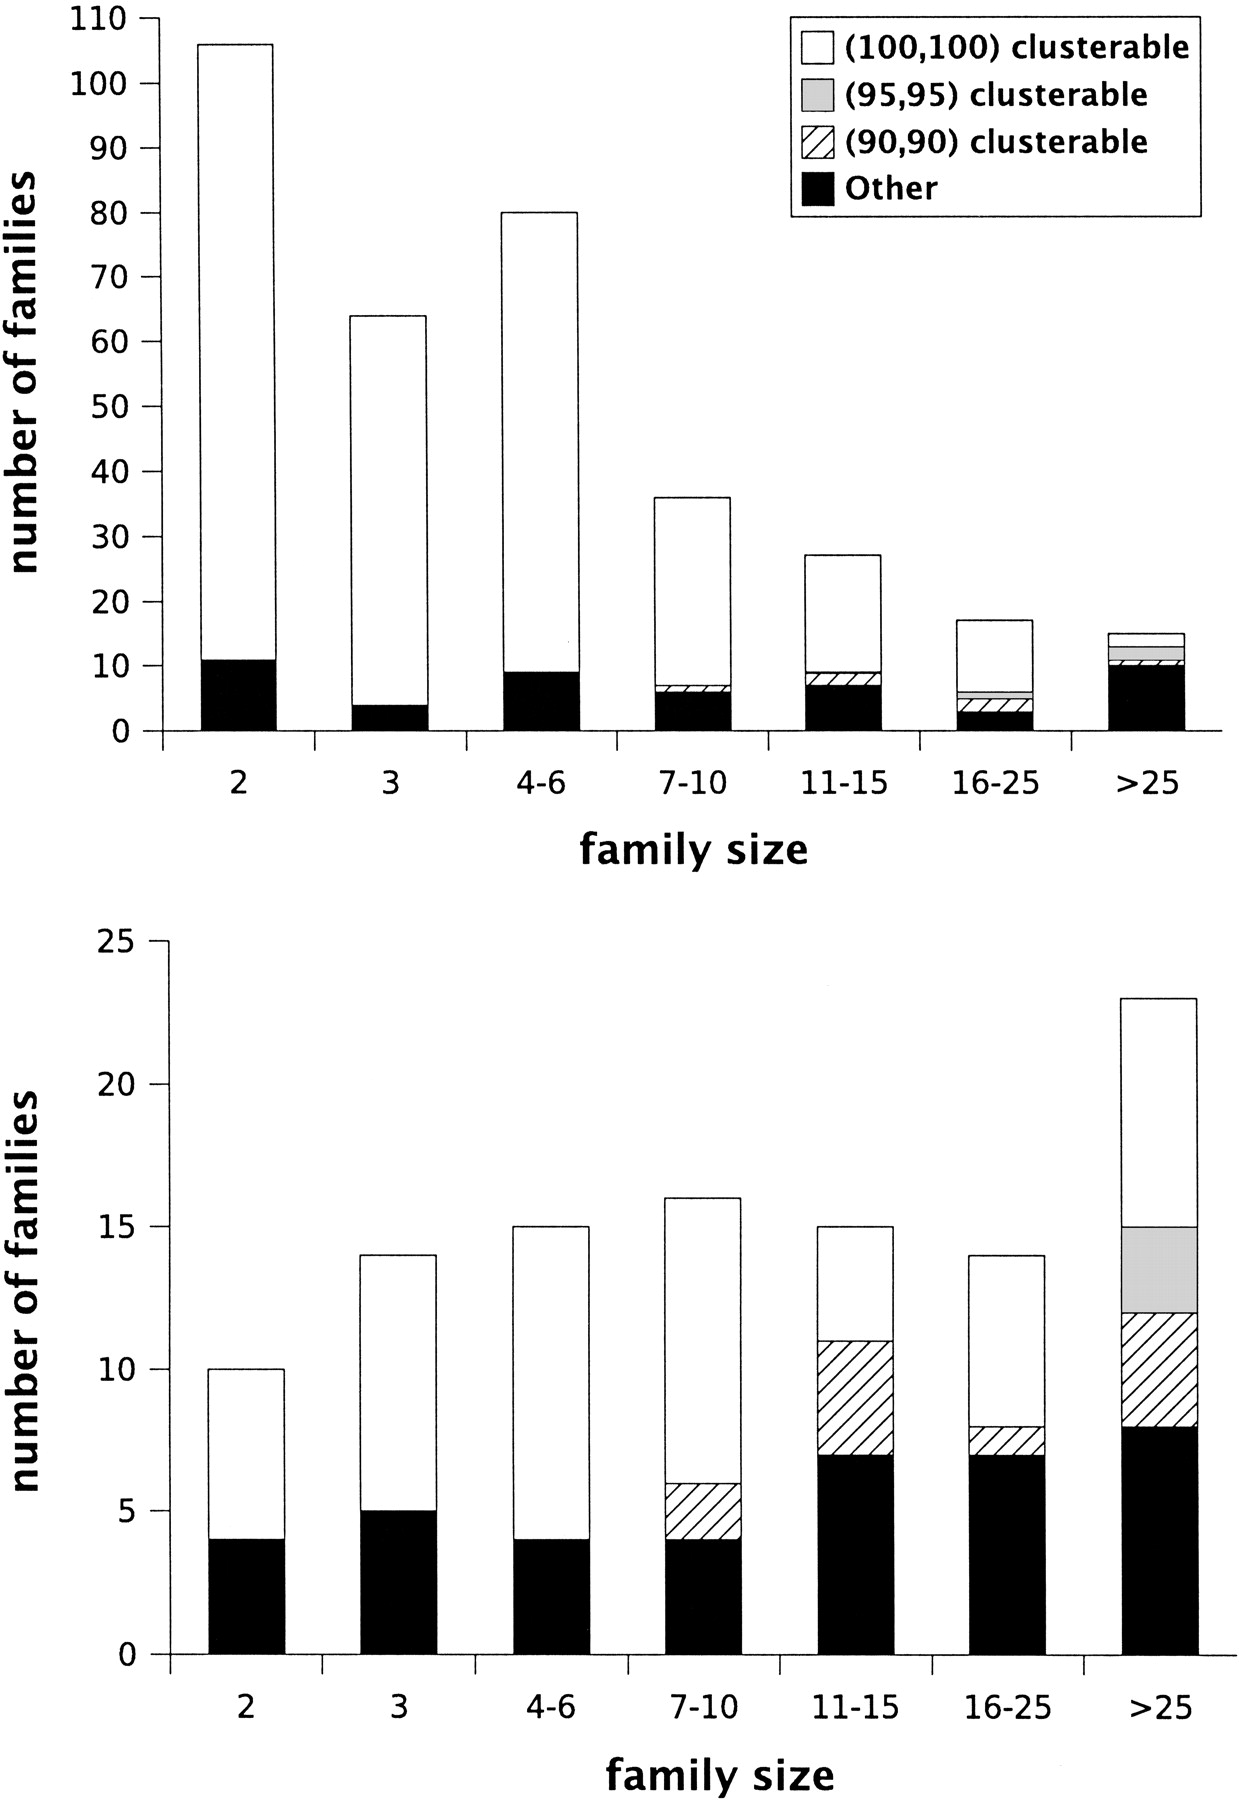
The graph at top shows the variation of clusterability with family size for atomic families. A similar graph for nonatomic families is shown at bottom. Please note that the scales used are different.
The graph at top shows the variation of clusterability with family size for atomic families. A similar graph for nonatomic families is shown at bottom. Please note that the scales used are different.