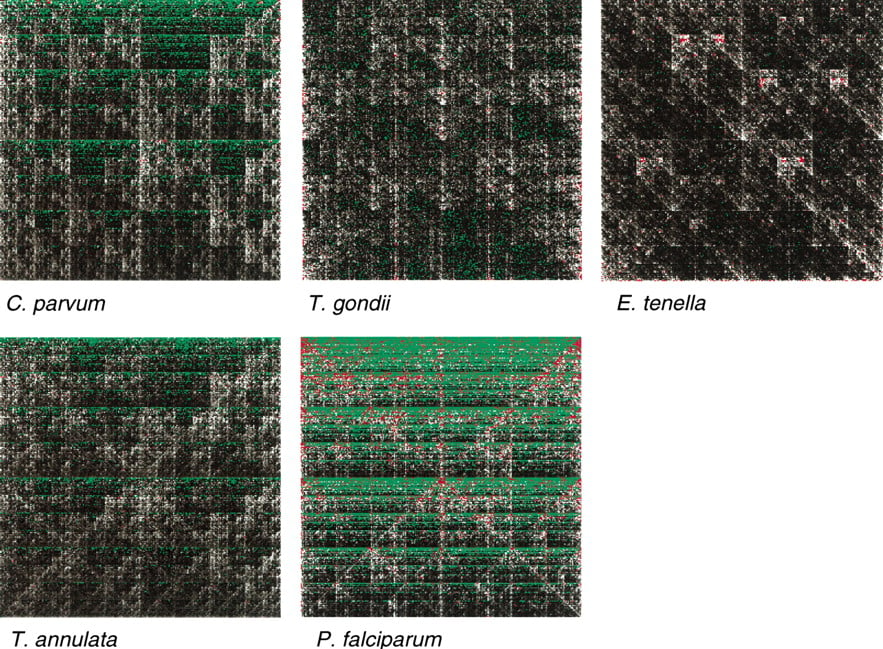
Figure 7
Normalized chaos plots for apicomplexan genomes. Each pixel represents the frequency of a given octamer sequence in the genome, relative to the frequency expected in a randomly ordered sequence with the same base composition as the genome in question (log scale; green <10-6; grayscale black through white =10-6 through 5; red >5). In each plot, the octamers [G]8, [C]8, [A]8, and [T]8 are represented at the top left, top right, bottom left, and bottom right corners, respectively.