Figure 5
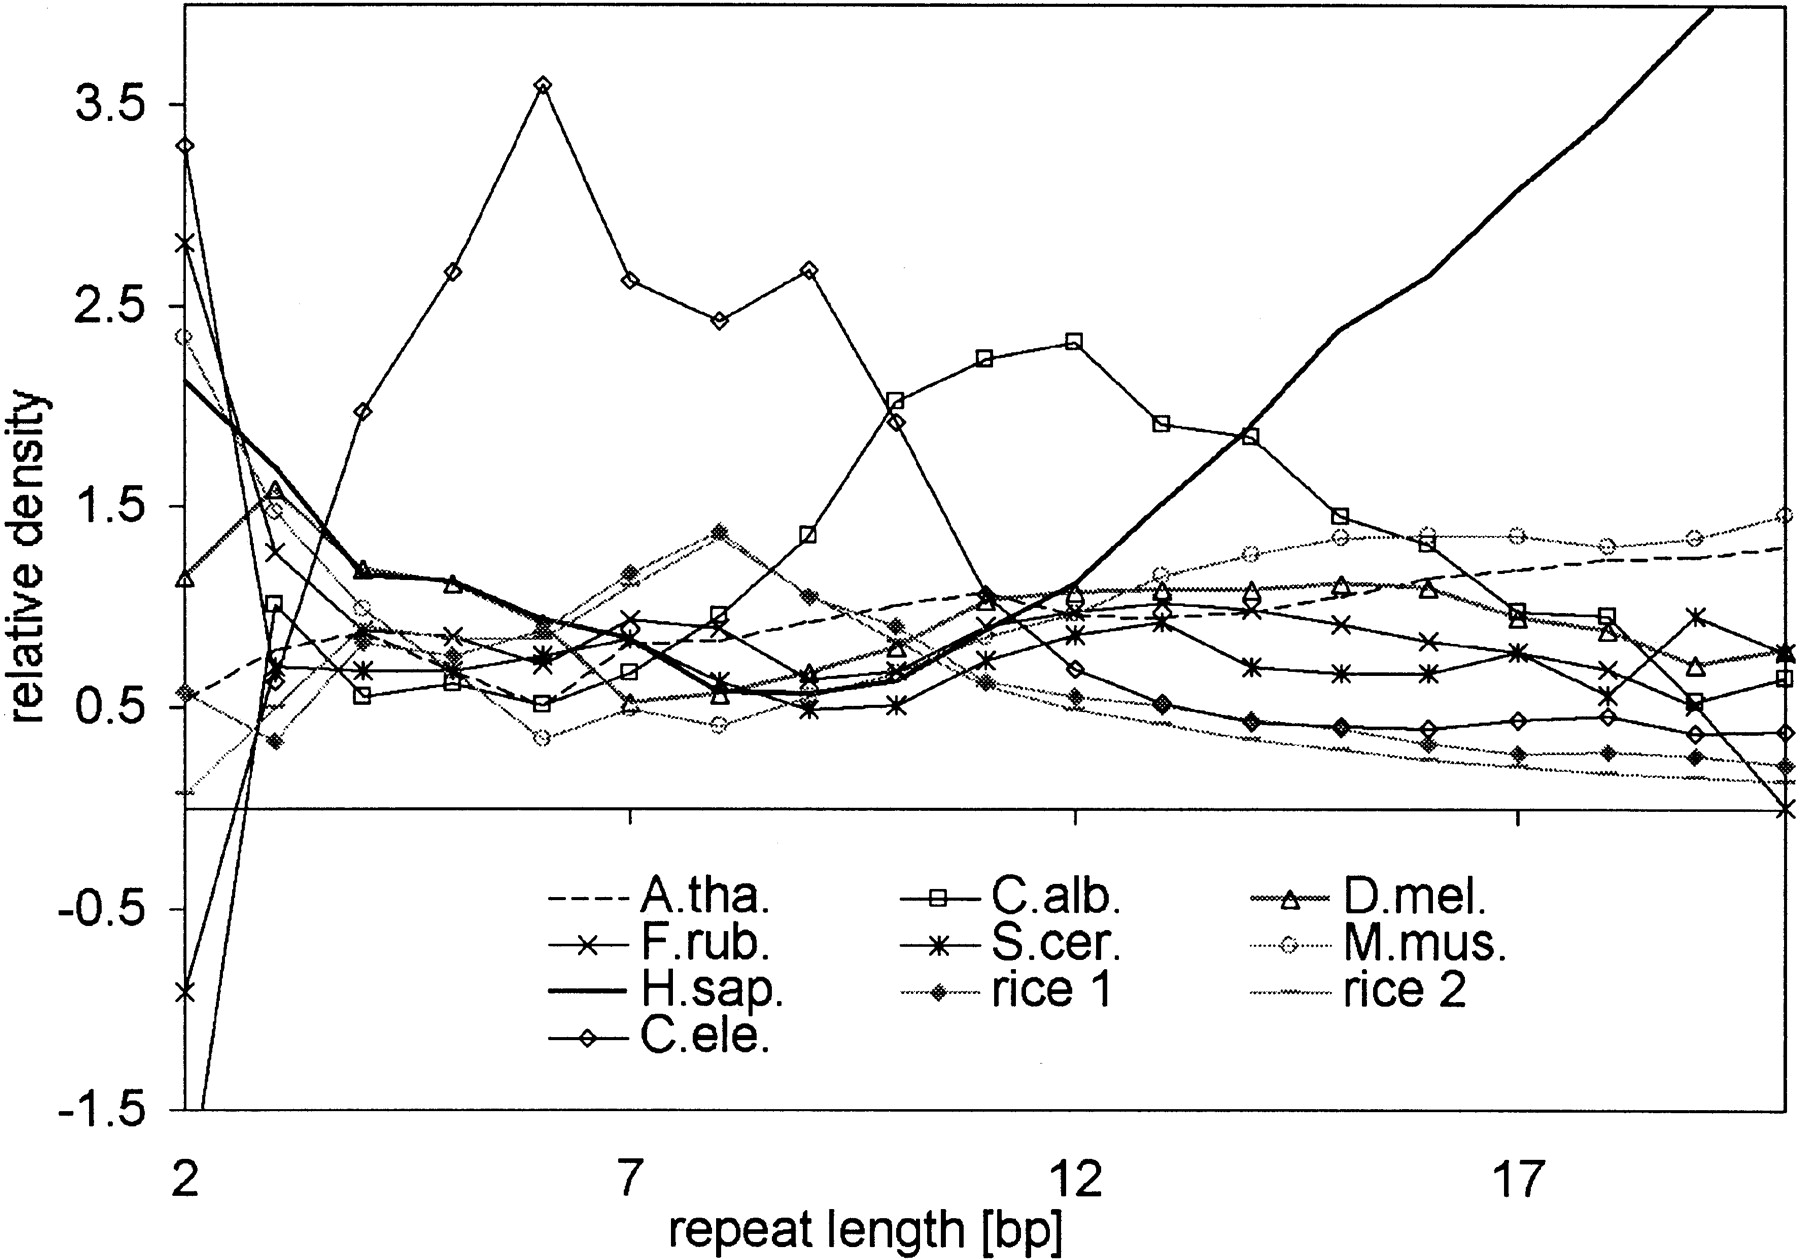
Relative density of mononucleotide microsatellites for all genomes plotted against repeat length. Relative densities were calculated by the comparison of a given species against the mean of all genomes (see text for details).
Relative density of mononucleotide microsatellites for all genomes plotted against repeat length. Relative densities were calculated by the comparison of a given species against the mean of all genomes (see text for details).