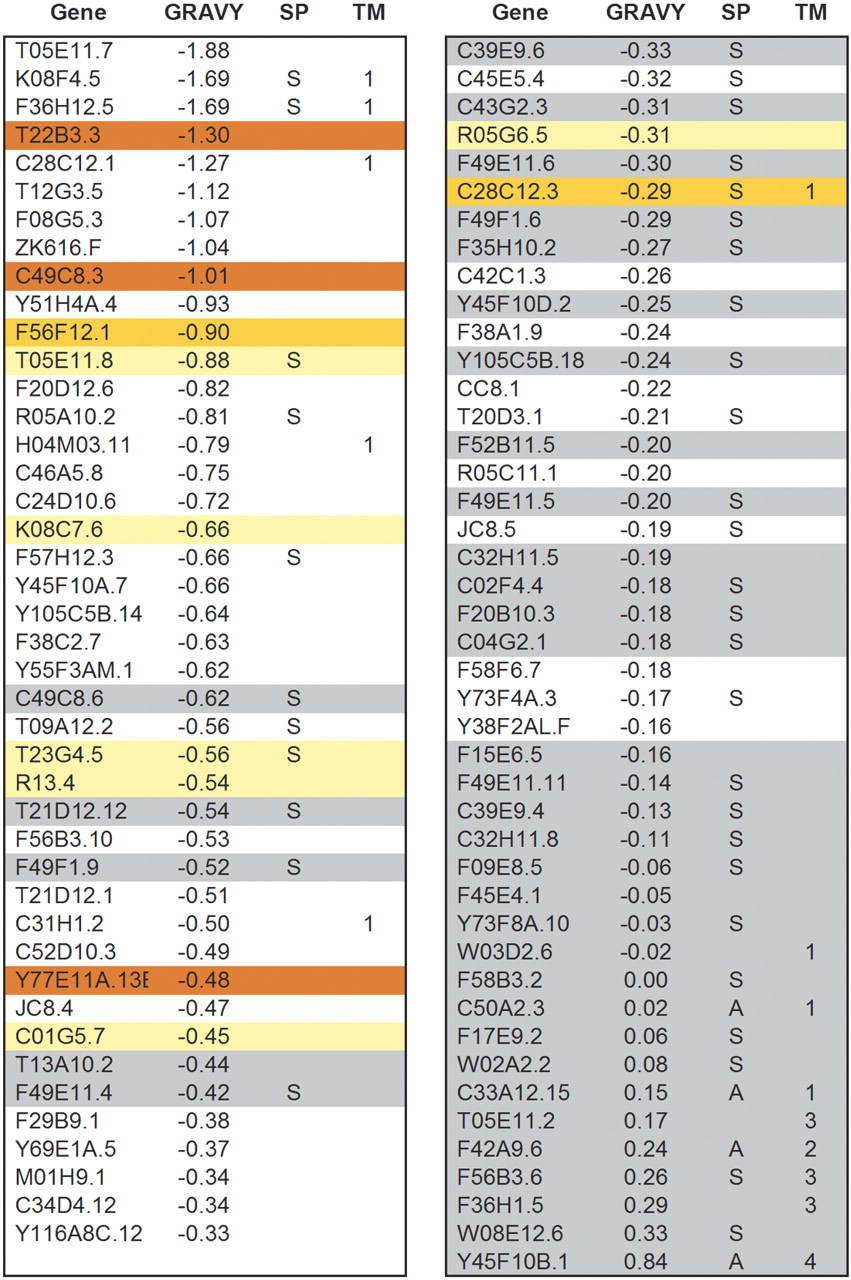
Figure 6
Expression data in correlation to GRAVY, Signal peptide, and Transmembrane helices as demonstrated on 87 ORFs for plate 11041. The genes are listed in two panels ordered by GRAVY value from low to high in the left panel and continued in the same manner in the right panel. The break point for the two panels was chosen for easy presentation. (Right) Higher GRAVY values. The expression data are color coded with gray for no expression, white for expression but not soluble, yellow for low level soluble, orange for mid level soluble, and red for high level soluble. (SP) Signal peptide or anchor; (TM) number of transmembrane helices.