Figure 6
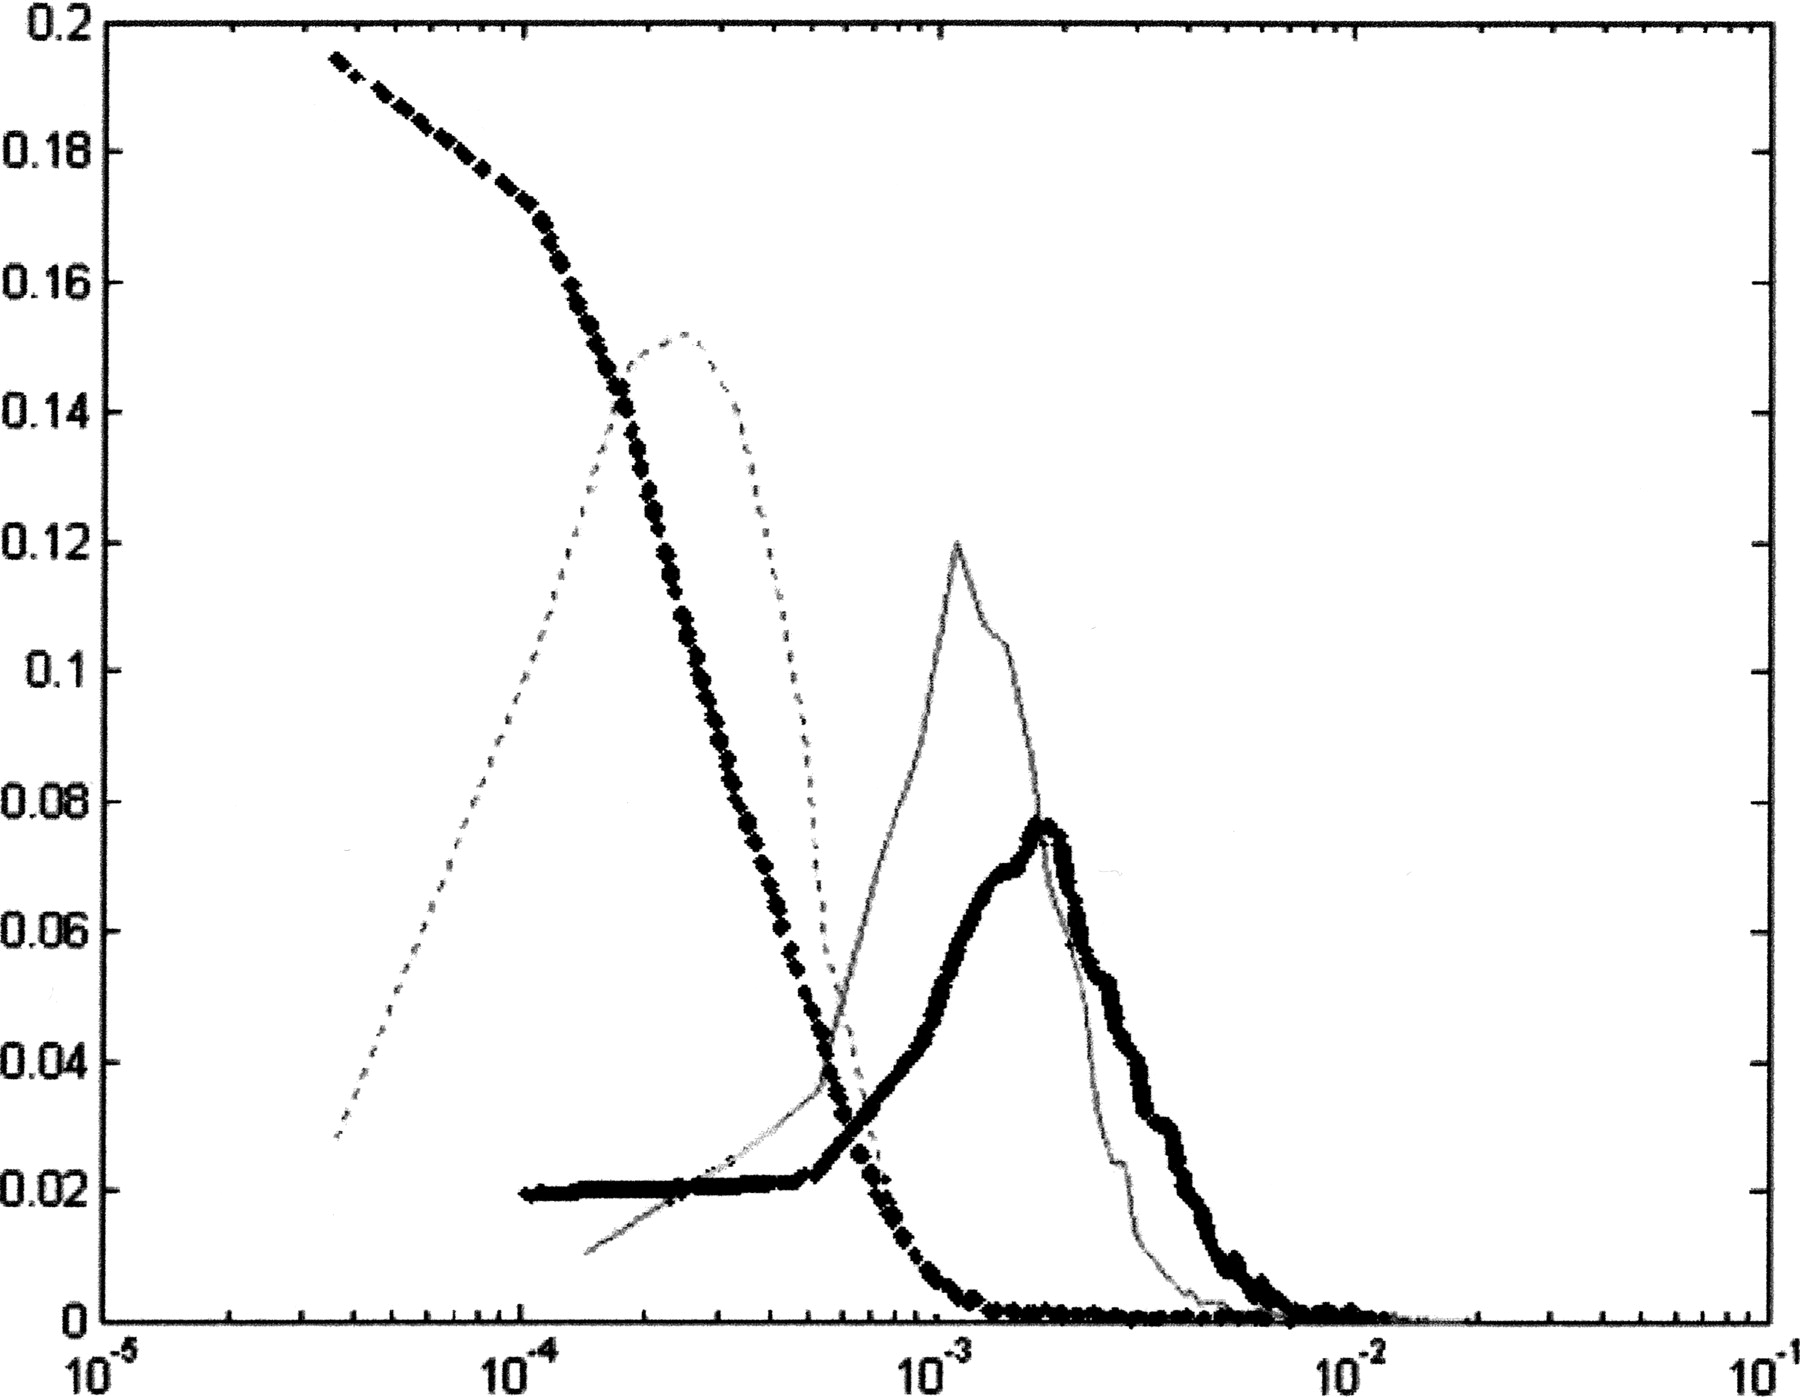
Probability density functions for Spectral Rotation (bold) and Spectral Content (fine) measures (solid lines represent exons and dashed lines represent noncoding regions).
Probability density functions for Spectral Rotation (bold) and Spectral Content (fine) measures (solid lines represent exons and dashed lines represent noncoding regions).