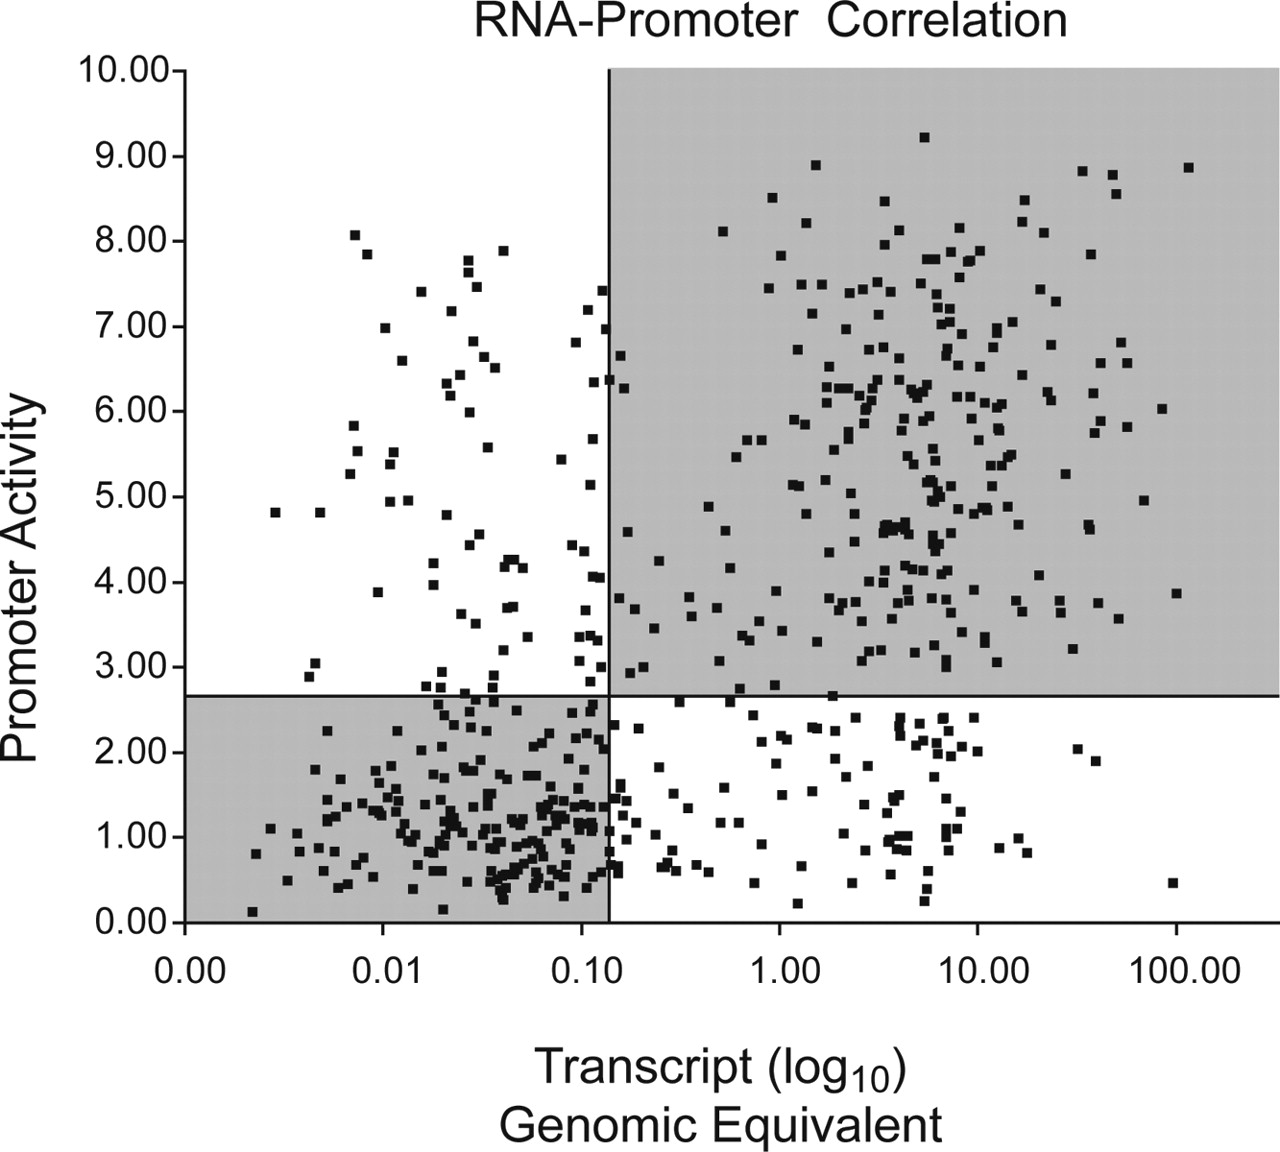
Figure 5.
Scatterplot of endogenous RNA transcript levels versus promoter activity. RNA levels, expressed as absolute genomic equivalents, are plotted on the x-axis and the normalized promoter activity is shown on the y-axis. We calculated the correlation coefficient, r = 0.53. (R2 = 0.28). Quadrants' boundaries are set by the median RNA transcript level (0.17 genomic equivalents) and median promoter activity (2.69 firefly luciferase/Renilla luciferase ratio).