Skip to main content
Figure 5.
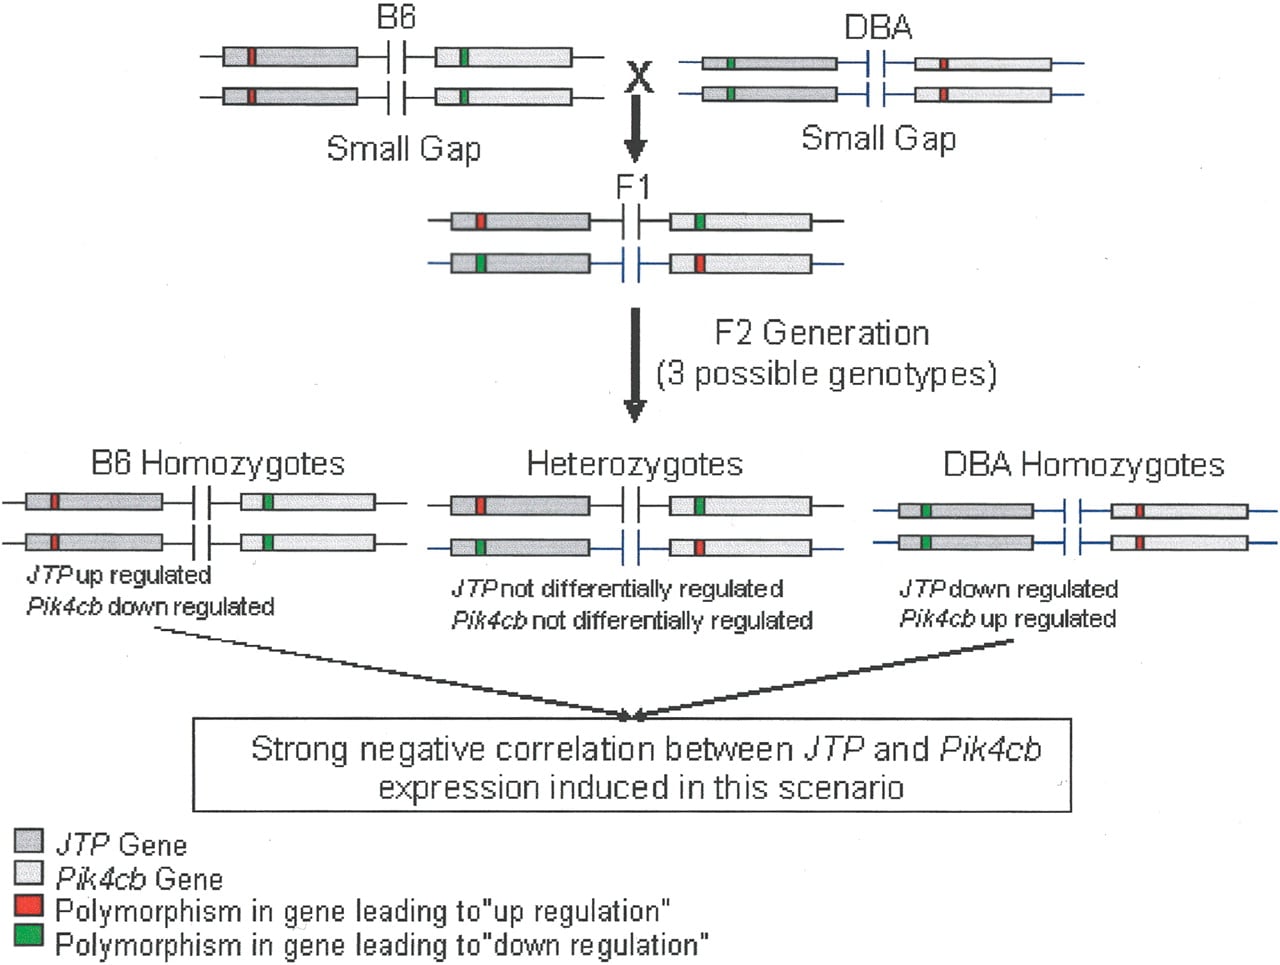
Diagram explaining the overall negative correlation observed in
Figure 3
.