Figure 5.
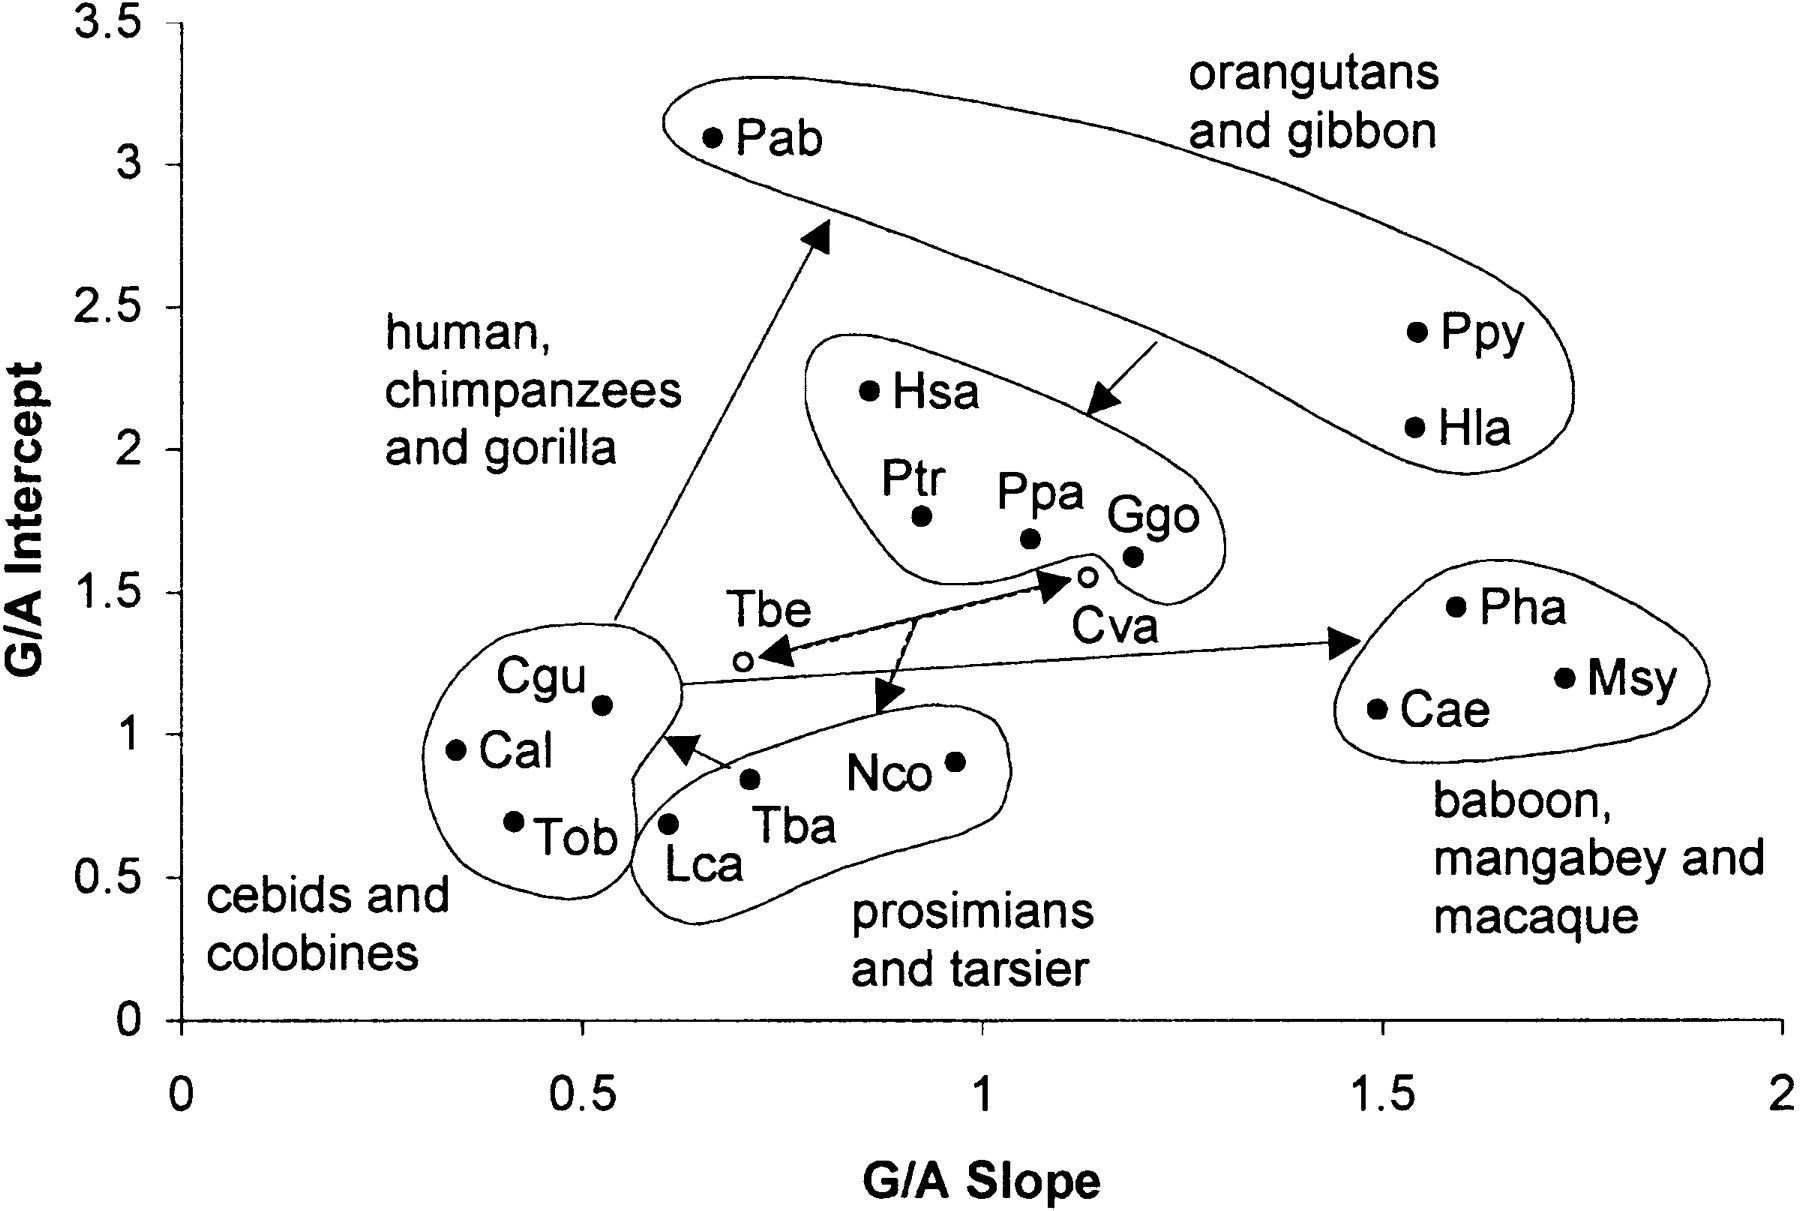
Graph of MLE slopes versus MLE intercepts along with major groups showing a summary interpretation of G/A evolution. Arrows indicate possible changes in response curves, and are discussed in the text.
Graph of MLE slopes versus MLE intercepts along with major groups showing a summary interpretation of G/A evolution. Arrows indicate possible changes in response curves, and are discussed in the text.