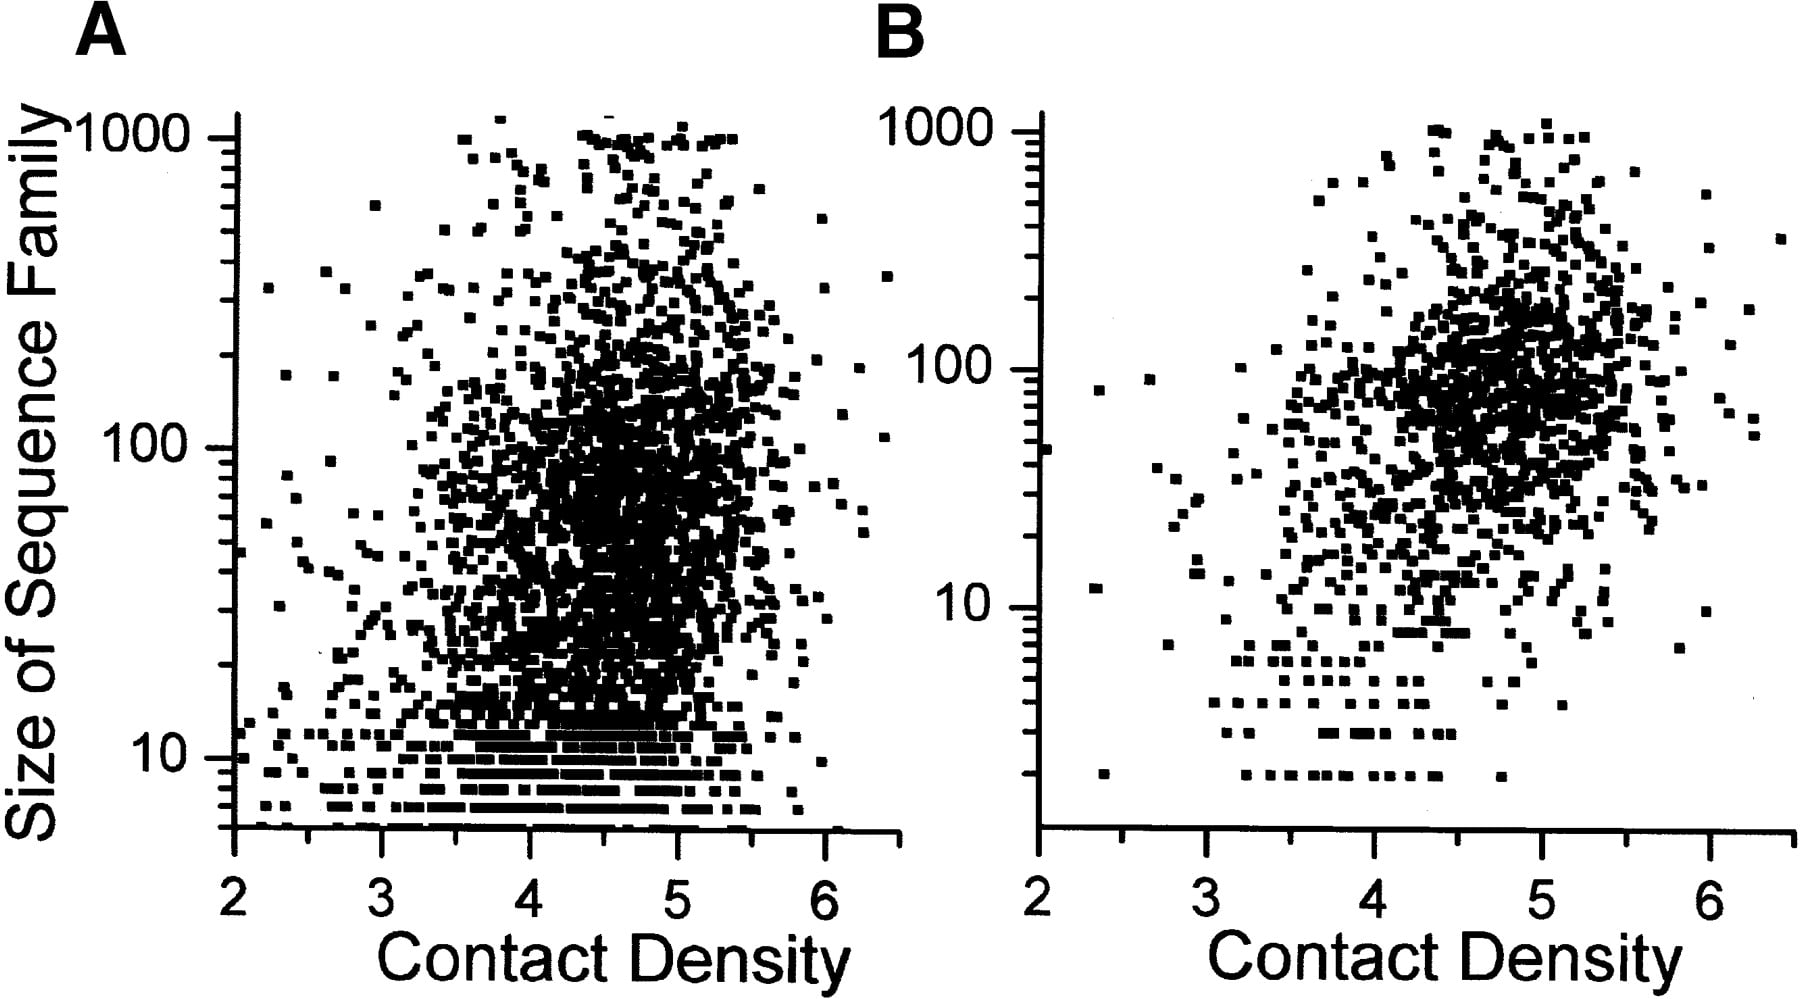
(A) Scatter plot of gene family size vs. CD for all PDUG domains. (B) The Scatter plot of only the domains that are shared between eukaryotes and prokaryotes (1117 domains). Note that these domains are statistically more designable (higher CD, difference of means 0.27, P-value < 1e-8) and that at the same CD, their families are more populated, on average 37 more members in each family. (P-value < 1e-10). Linear fit to all domains vs. gene family size returns R = 0.30 with P < 0.001, while linear fit to only LUCA domains vs. gene family size returns R = 0.40 with P < 1e-4. Random resampling of LUCA domains yields mean R = 0.30 and standard deviation 0.025. The LUCA domains are not statistically overrepresented in genomes, so the sampling bias is not expected to account for the difference in family sizes.