Figure 5.
Scatterplot of FST between European and Chinese samples for ascertainment-corrected 500-kb windows of the HapMap data vs. the Perlegen data.
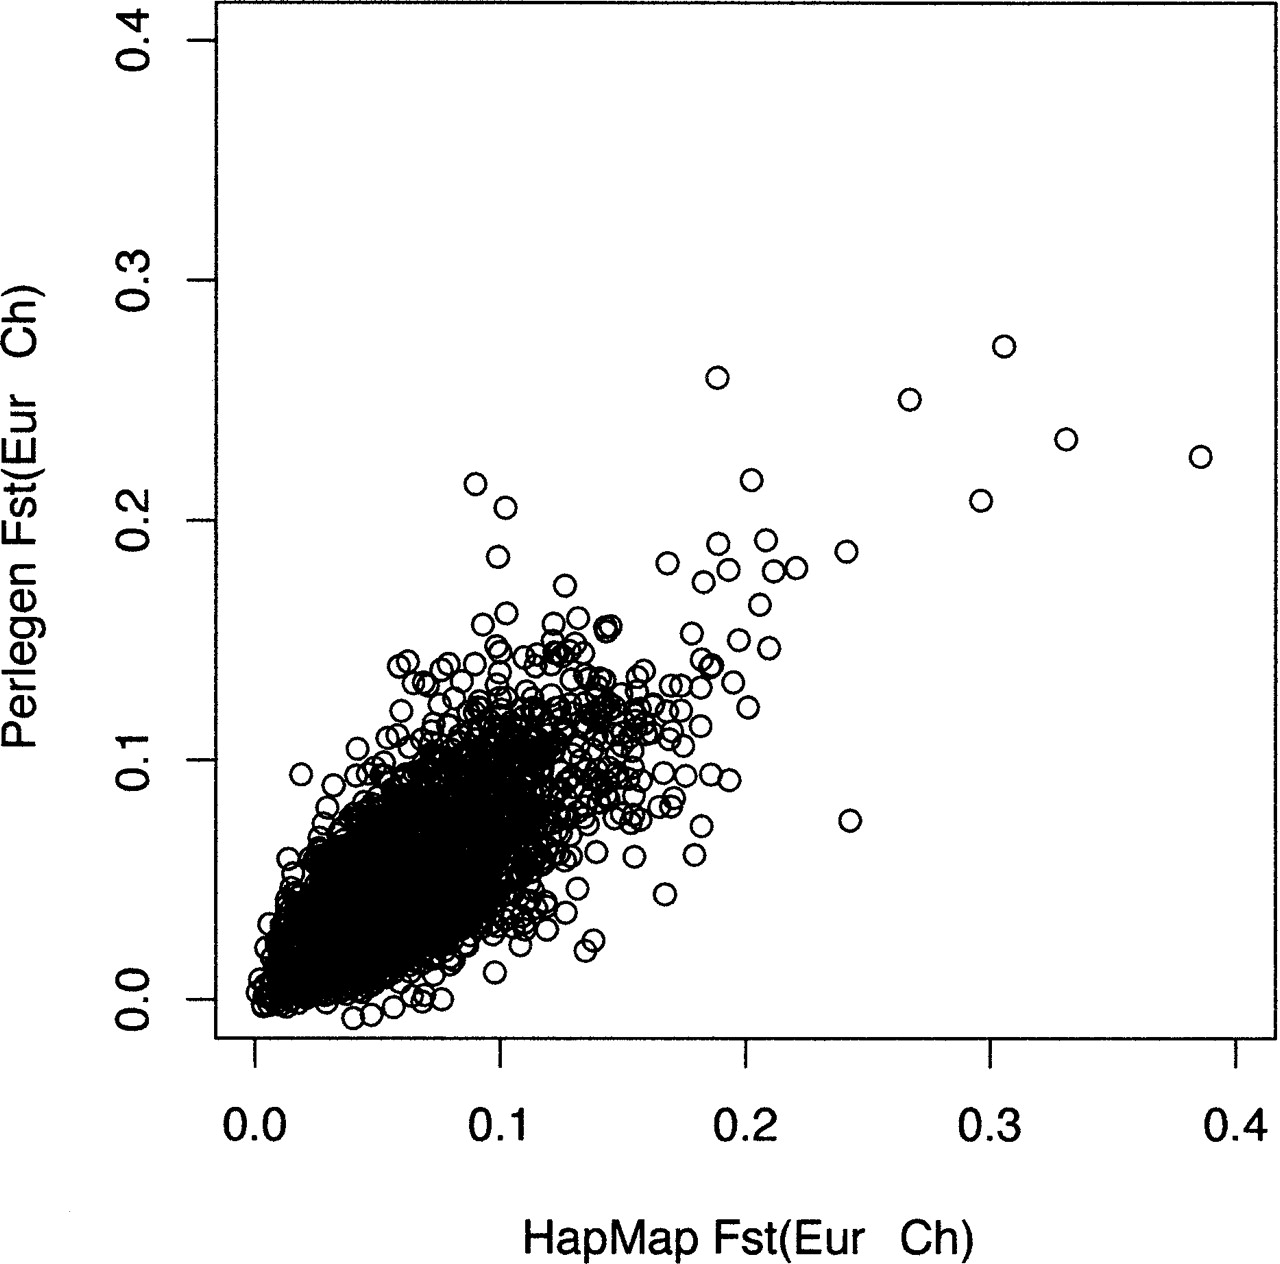
Scatterplot of FST between European and Chinese samples for ascertainment-corrected 500-kb windows of the HapMap data vs. the Perlegen data.