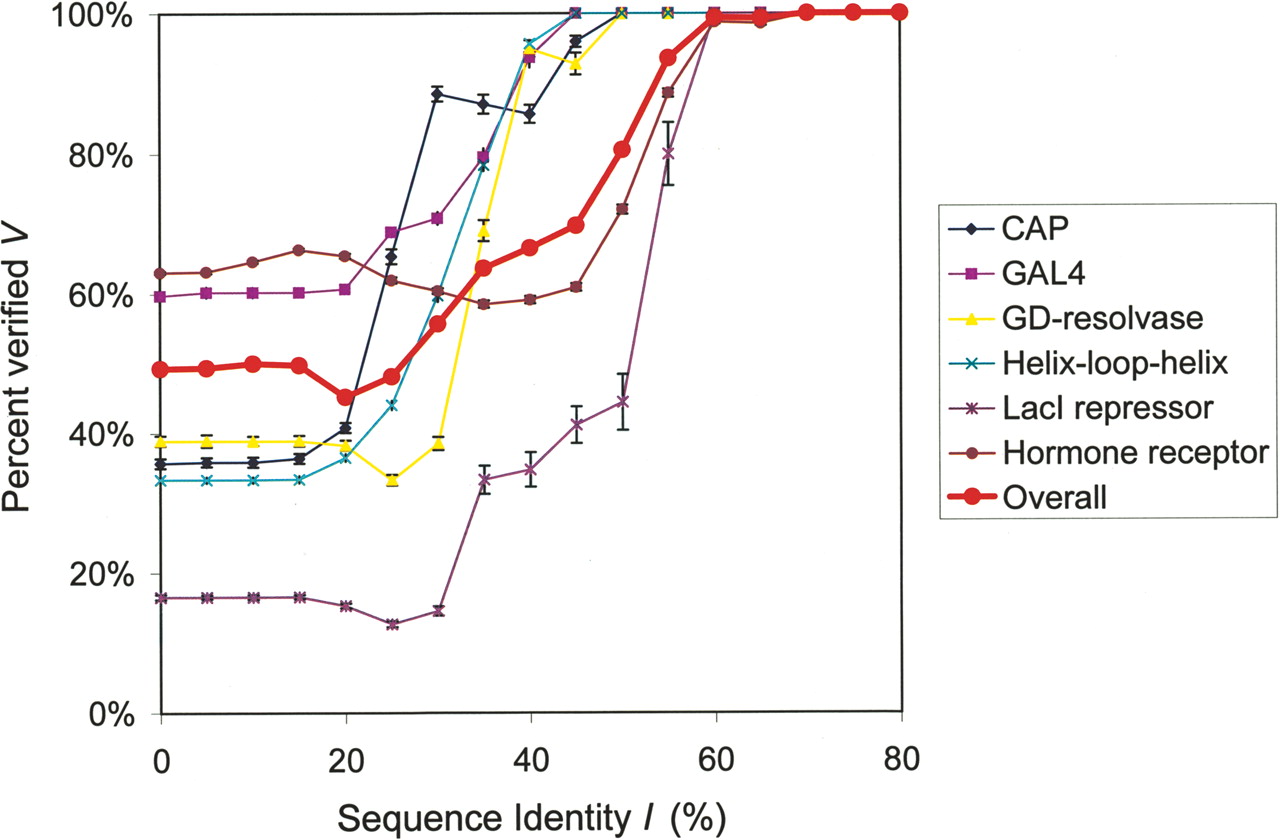
Figure 5
Conservation of protein–DNA interactions between homologous TFs. The conservation is measured as the relationships between V and I. The legend appears as an inset on the graph. The red, bold curve was calculated for all TFs in the source data sets (see Supplementary material). Error bars represent 95% CI calculated by the resampling algorithm.