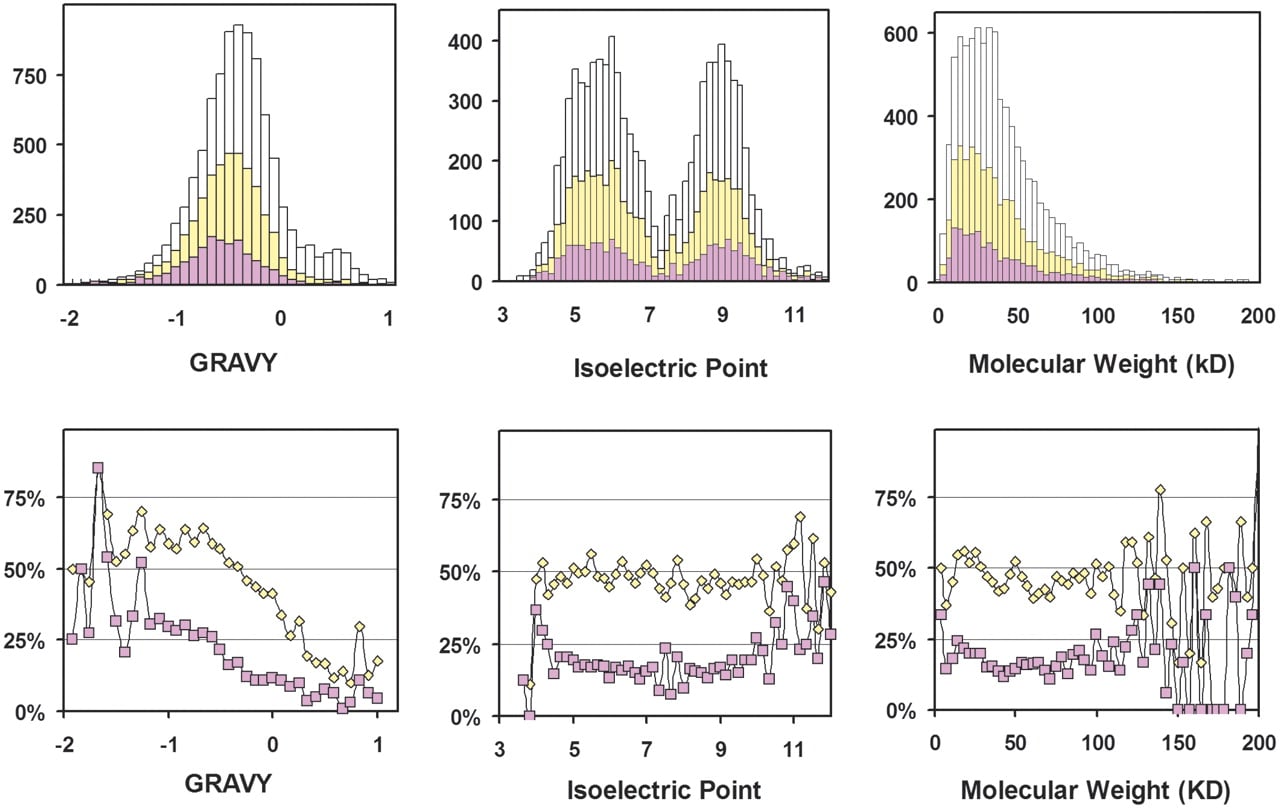
Figure 5
Histograms (top) of GRAVY, molecular weight, and isoelectric point for the 10,167 ORFs studied (white), expressed (yellow), and soluble (pink), and percentage plots (bottom) of the expressed and soluble ORFs over the studied, respectively, vs. the three parameters. Correlation between protein expression and GRAVY is apparent in the plots. The lack of a correlation to isoelectric point and molecular weight is indicated by the flatness of the curves in the percentage plots.