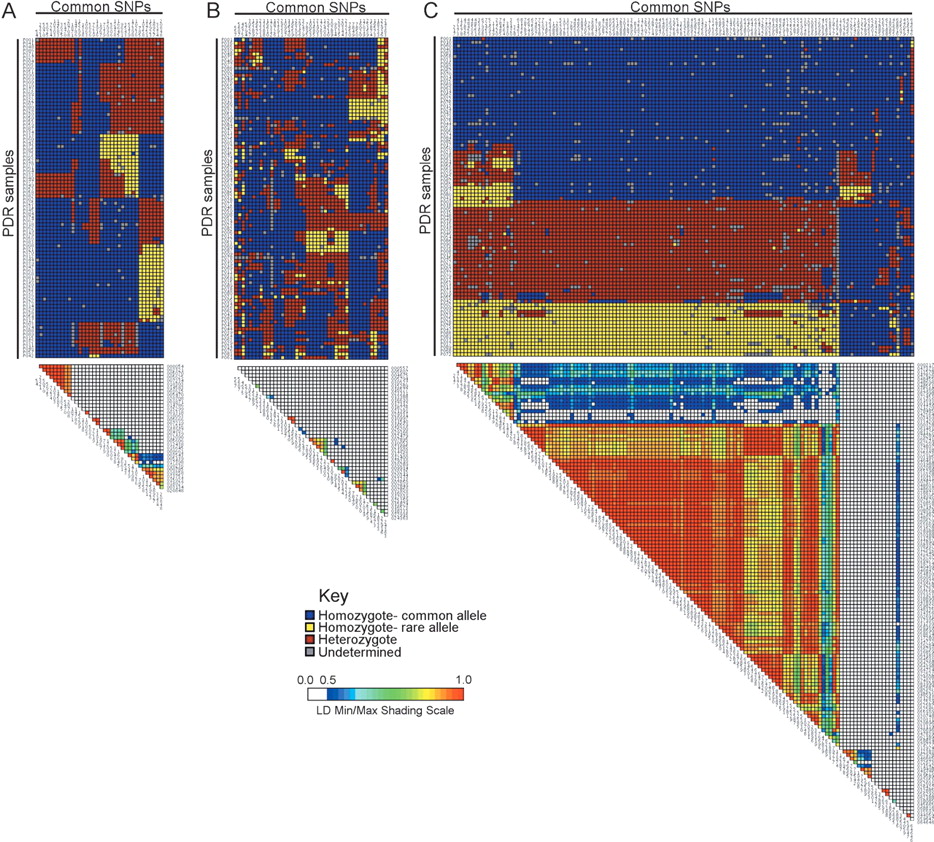
Figure 5
Examples of linkage disequilibrium, as measured by r2, in candidate environmental response genes. (A) BNIP1 exhibits average LD, (B) CCND2 exhibits low LD, and (C) BRCA1 exhibits strong LD. The top portion of each graphic illustrates the visual genotypes for each gene, in which each column represents a site (blue indicates common homozygote; yellow, rare homozygote; red, heterozygote; and gray, missing data) and each row represents an individual from the PDR. The bottom portion of each graphic is the LD plot for each gene, measured by r2, and depicted on a rainbow scale (white indicates weak LD; red, strong LD).