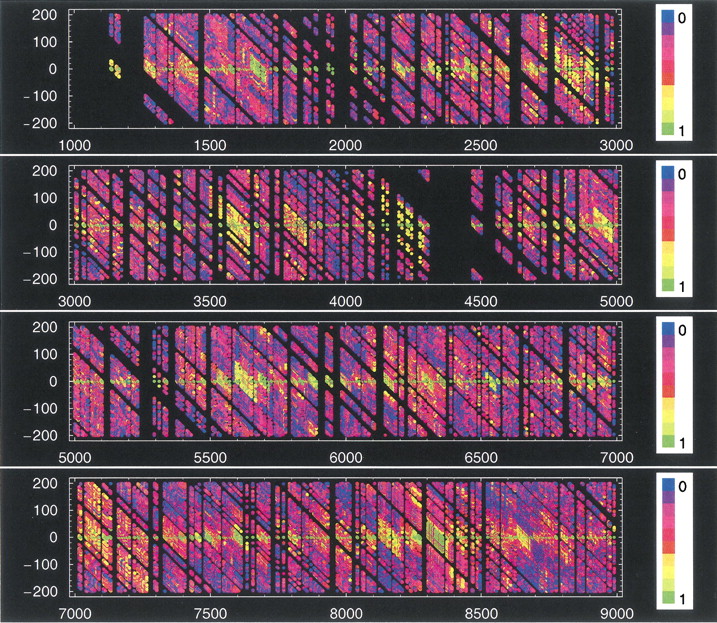
Figure 5
The pattern of LD along chromosome 21.The color of each point represents the absolute value of r, the correlation coefficient between SNPs (with respect to haplotype) at a pair of loci. The position of one of the loci is given (in kb) on the x-axis; the position of the second is given relative to that of the first (again in kb) on the y-axis. Thus, each vertical slice shows the pattern of LD in a 400-kb window around a particular SNP locus. The four panels show the pattern for the first 9 Mb; the remainder of the chromosome is shown in Figures 6 and 7.