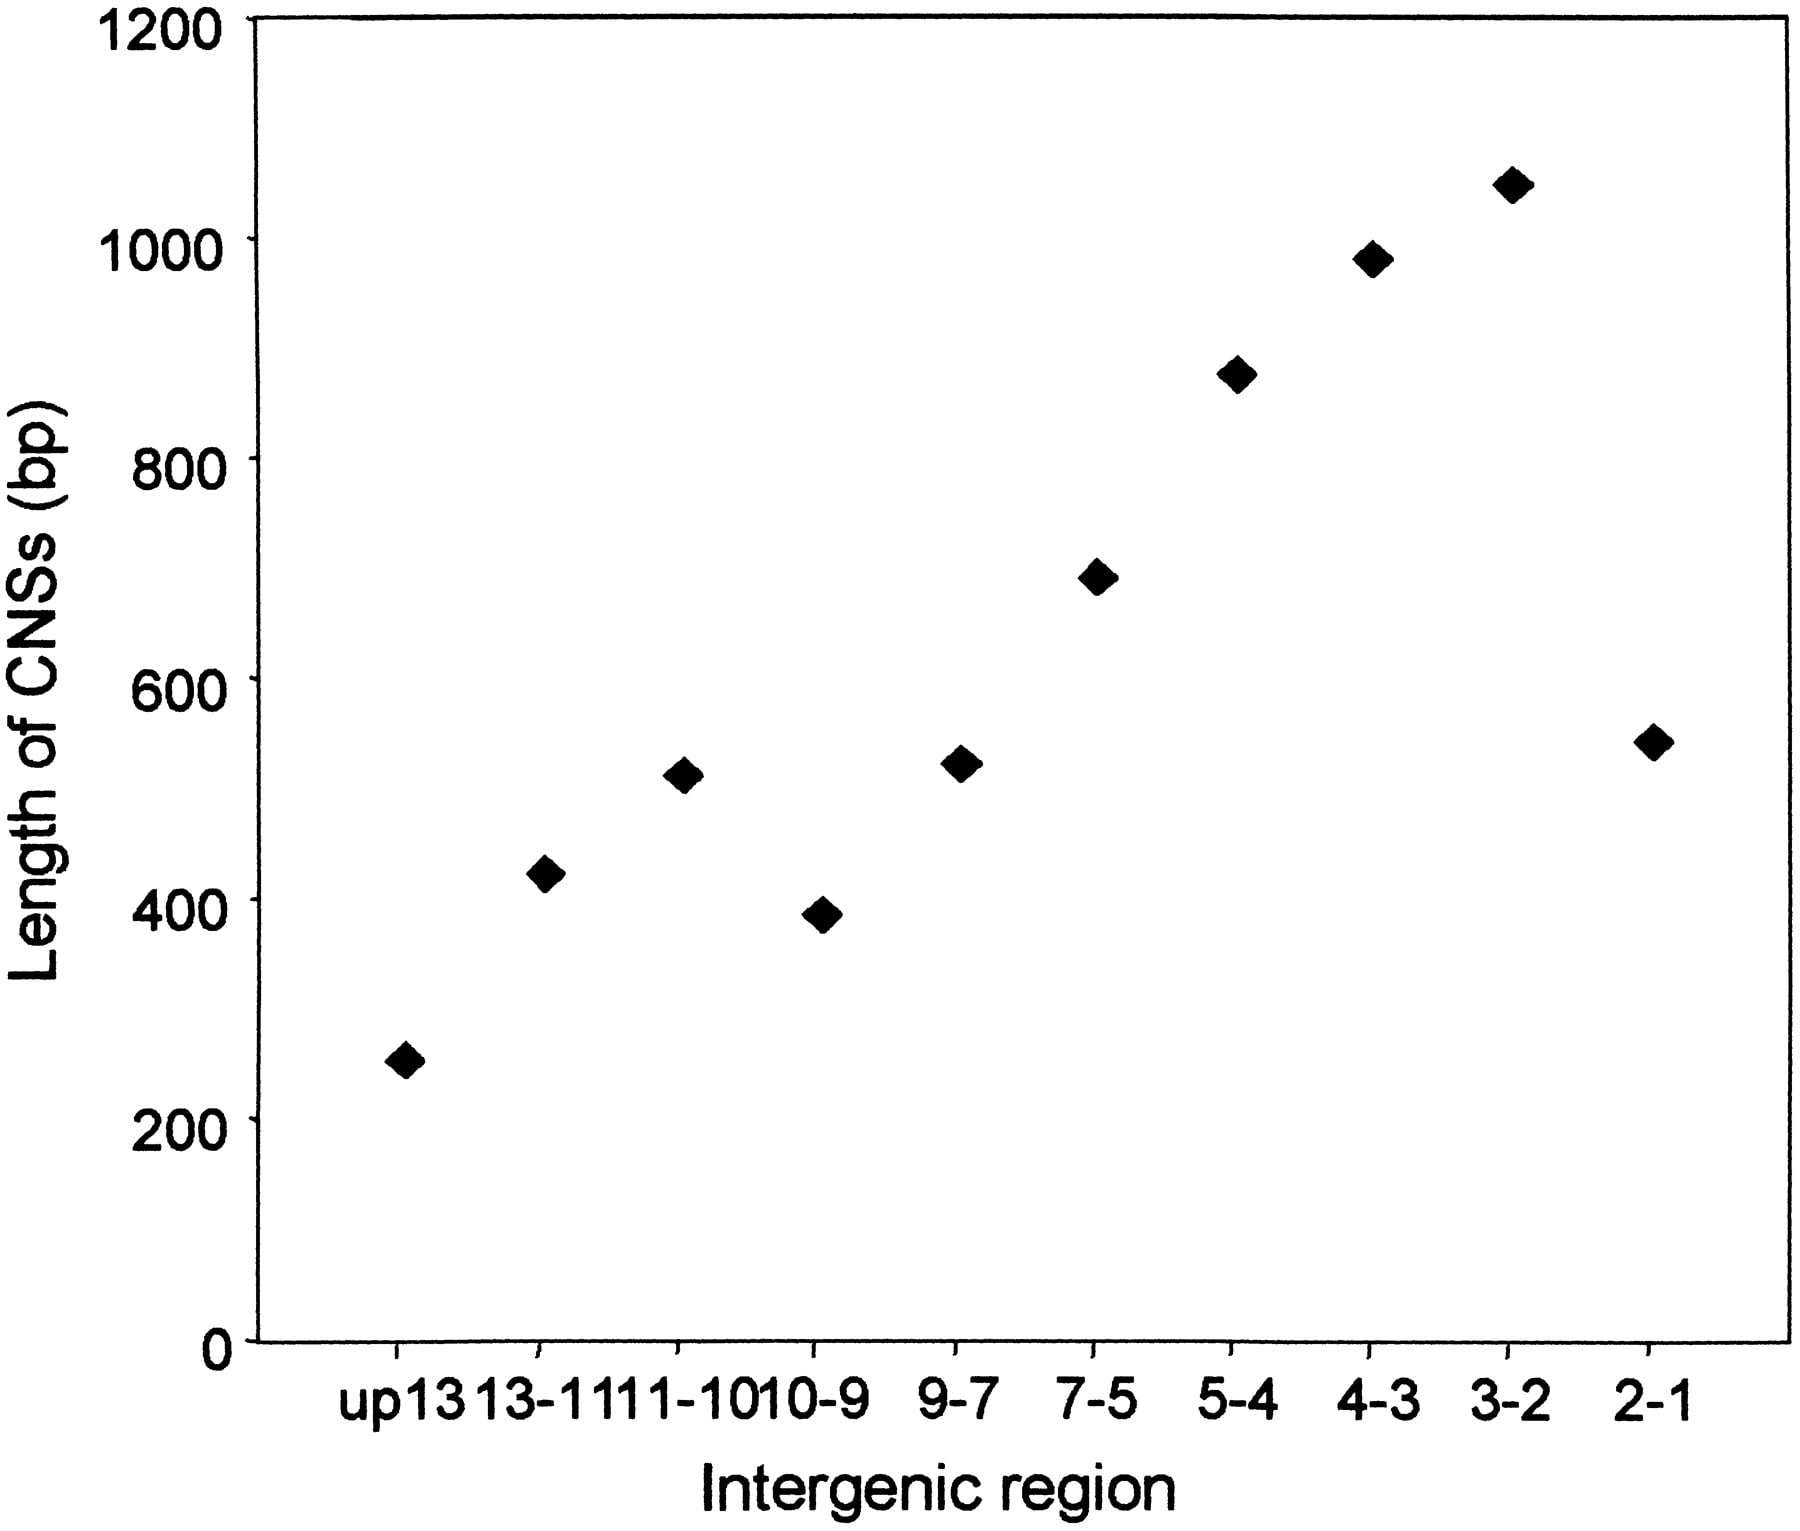
Figure 5
Total lengths of CNSs for each intergenic region. The intergenic regions located 3′ in the cluster are better conserved than those between genes located 5′ in the cluster. The graph shows the number of conserved bases (CNS as defined in text) per intergenic region. There is a significant relationship between the number of conserved bases per intergenic region and the position of the region in the cluster (P = 0.007).