Figure 5
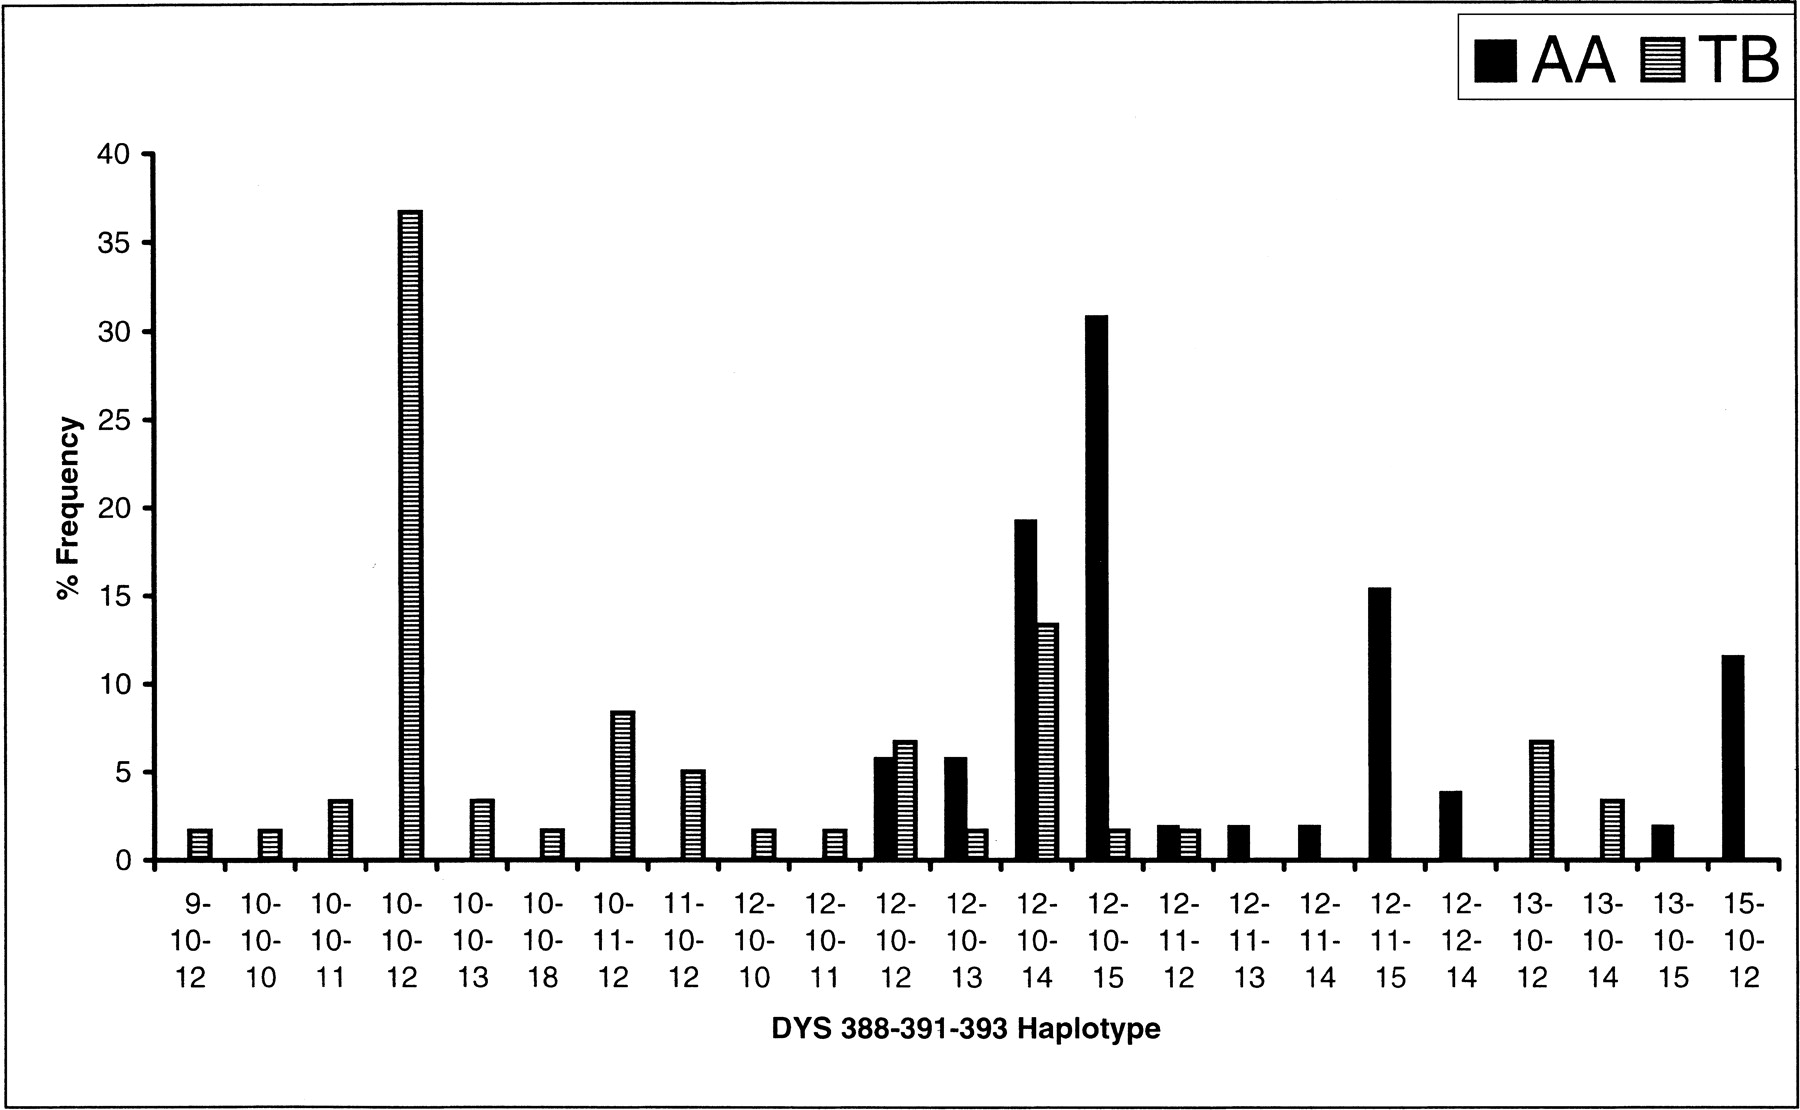
Frequency distributions of Y-chromosomal STR haplotypes that best discriminate between the Austro-Asiatic (AA) and Tibeto-Burman (TB) population groups.
Frequency distributions of Y-chromosomal STR haplotypes that best discriminate between the Austro-Asiatic (AA) and Tibeto-Burman (TB) population groups.