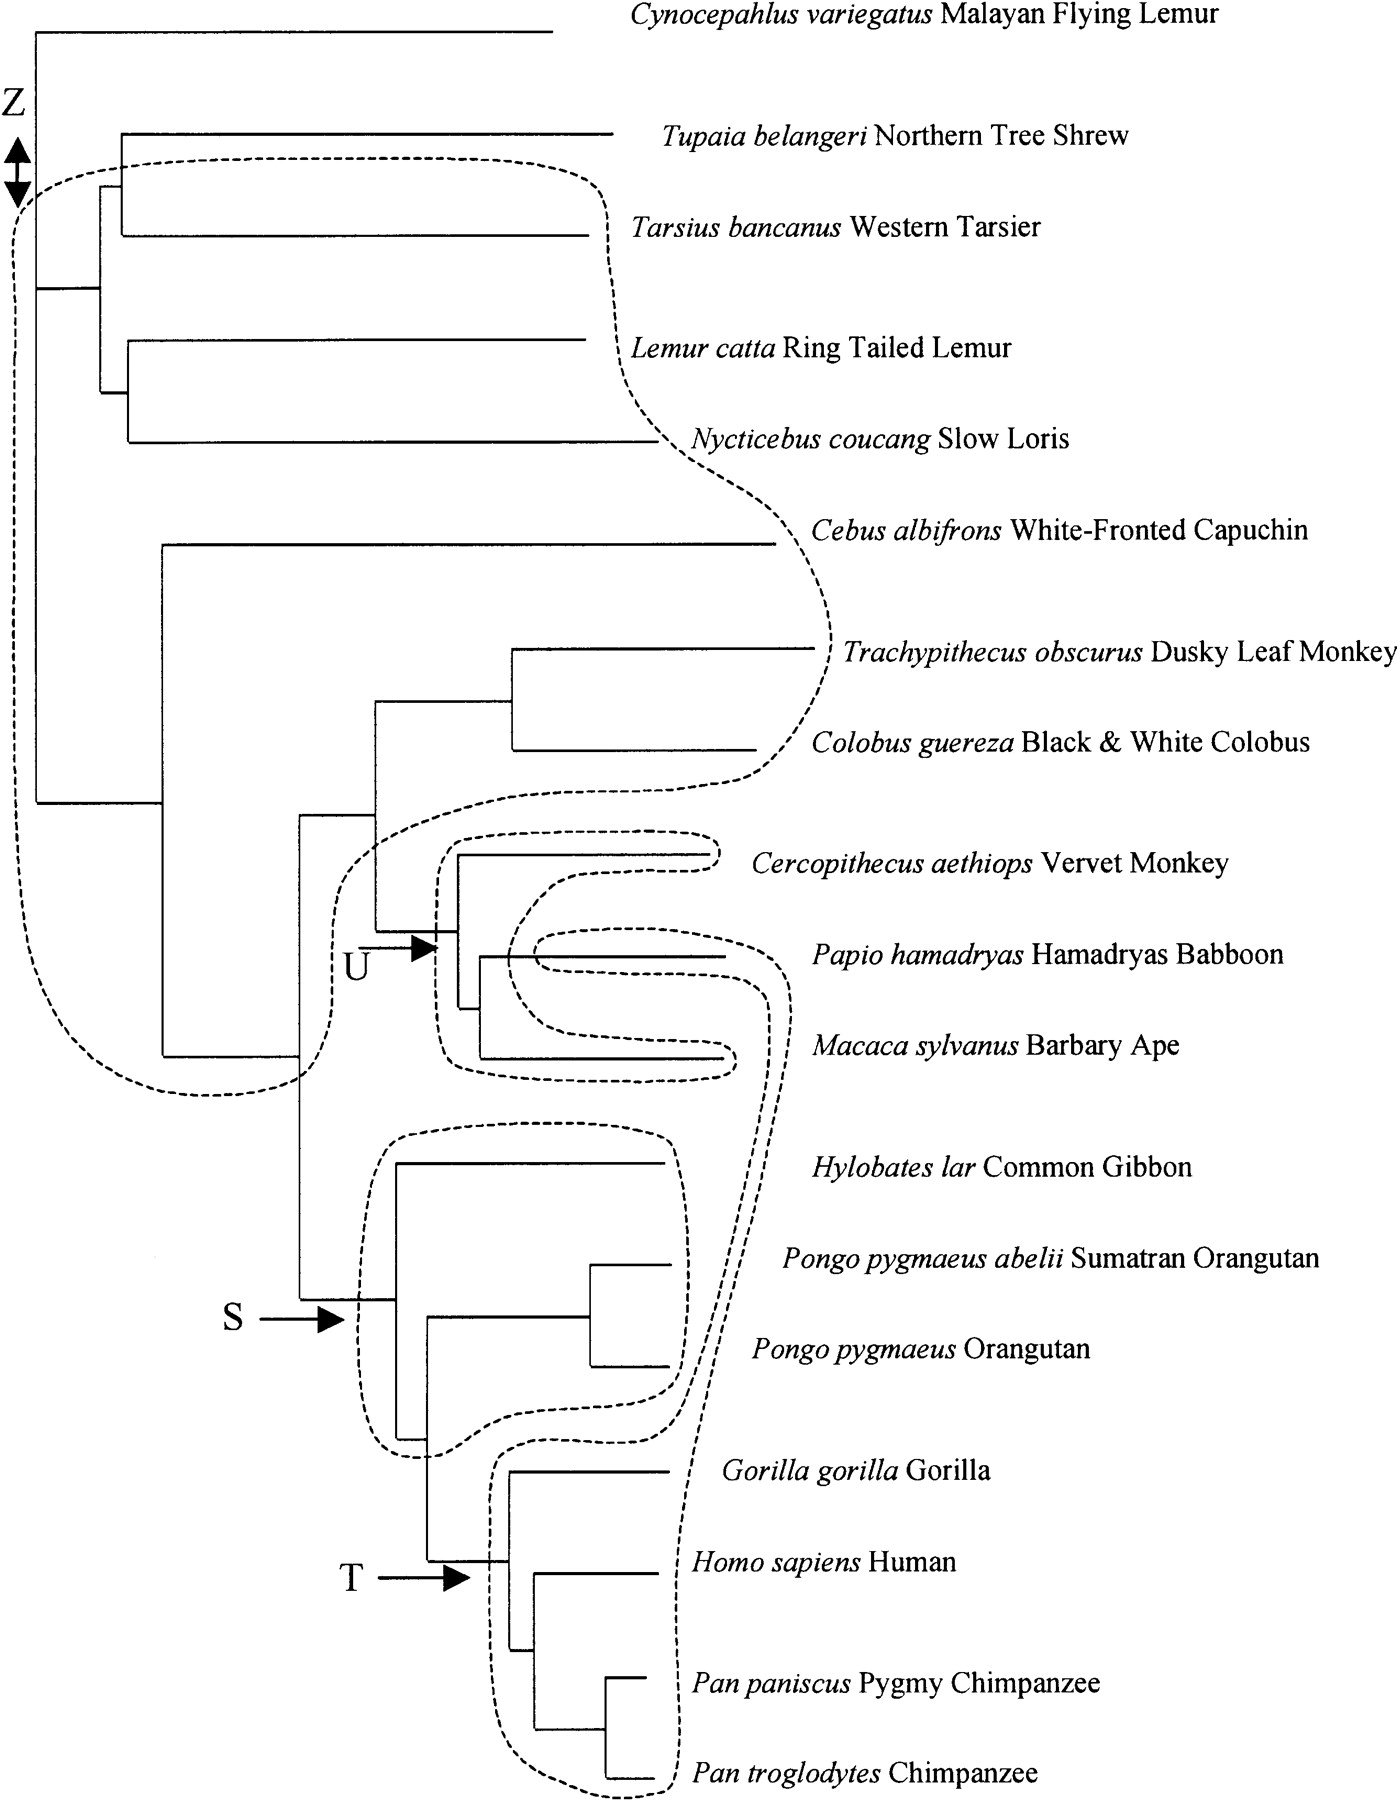
Figure 4.
G/A mixture model groups mapped onto a phylogenetic tree of the primate species used in this study. This is the primate phylogeny most compatible with the mitochondrial sequences, but is probably inaccurate in some topological details (see Methods). Arrows indicate possible locations of large changes in the response curve, and are labeled to match the mixture model clusters in Figure 2B. A double-headed arrow is used between the flying lemur and the rest of the species to indicate the slight ambiguity in its outgroup status, as discussed in the text. Clusters shown are for the model with five clusters, except that clusters V and W have similar slopes and intercepts, and are grouped into cluster Z as in the three-cluster analysis.