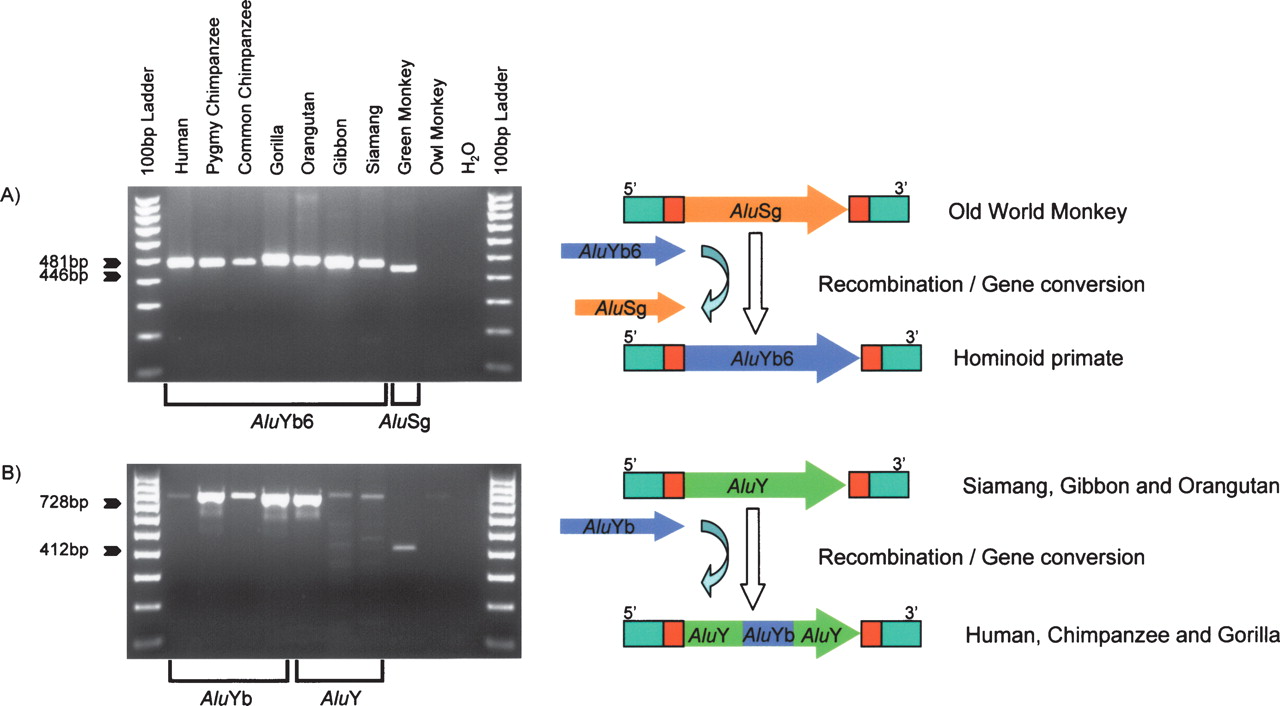
Figure 4.
Gene conversion of AluYb elements. Gel chromatographs of PCR products derived from a phylogenetic analysis of the Pan2 locus (A) and Pan3 locus (B) are shown at left. The DNA template used in each lane is shown at top. The product sizes for filled and empty alleles (pre-integration size) are indicated at left. The schematic diagrams depict the potential evolutionary scenarios on the right. Flanking sequences are shown as green boxes; target site direct repeats are shown in red boxes. Alu elements are shown as arrows, and the direction of the arrow indicates the orientation (5′→3′), with the head of the arrow denoting the end of the Alu elements.