Figure 4.
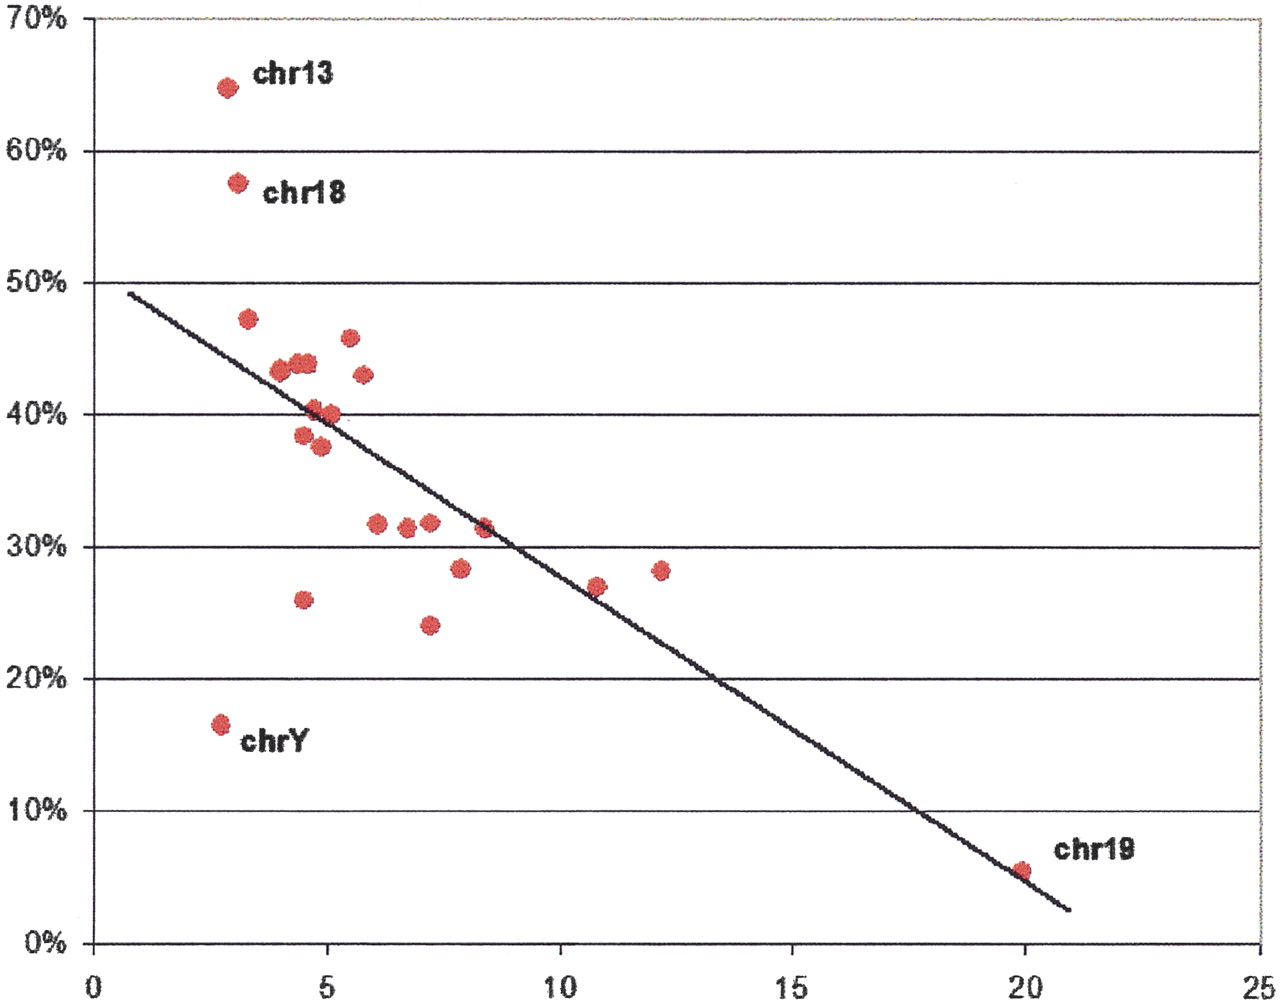
Percentage of genes with UTRs conserved in chicken (vertical axis) versus the gene density (based on RefSeq annotation; in genes per 1 Mb of sequence as plotted at the horizontal axis). Red dots describe different human chromosomes.
Percentage of genes with UTRs conserved in chicken (vertical axis) versus the gene density (based on RefSeq annotation; in genes per 1 Mb of sequence as plotted at the horizontal axis). Red dots describe different human chromosomes.