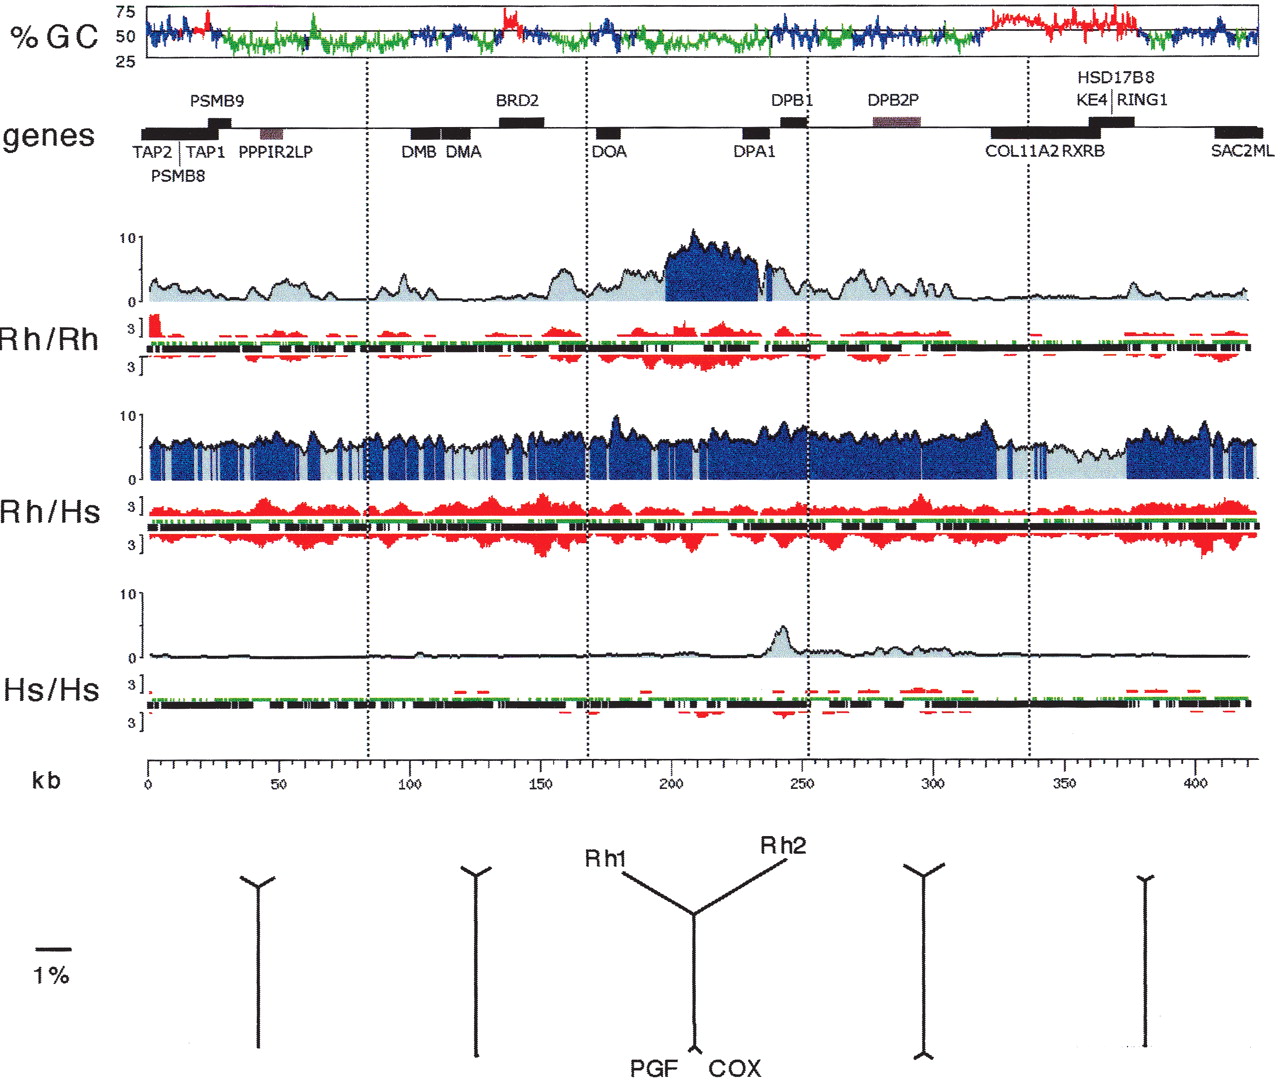
Distribution of mutational events over a 470-kb segment of the MHC class II region. Pairwise comparisons of the two rhesus haplotypes, the two human haplotypes, and one haplotype of each species is indicated immediately to the left of each graph. The graphs reflect the analysis of the aligned sequences only, excluding insertions or deletions. (%GC) G+C content graph in 500-bp windows. Green, blue, and red indicate isochore regions of low, medium, and high G+C content, respectively (window size is 30 kb long, cutoffs are 43% and 50% G+C). (Genes) Location, strand, and identity of genes (black) and pseudogenes (gray). (Rh/Rh) Comparison of the two rhesus haplotypes. The percent divergence is shown in blue (averaged over 2.5-kb windows), with dark blue indicating regions over 5% divergence; the number of insertion/deletion events (at least 3 bp long, averaged over 4.5-kb windows) is shown in red, with upward peaks indicating insertions in Rh1 relative to Rh2, and downward peaks indicating insertions in Rh2 relative to Rh1; aligned regions deriving from interspersed repeats or from unique sequences are shown as green or black horizontal bars, respectively. (Rh/Hs) Comparison of Rh1 with the human COX haplotype. (Hs/Hs) Comparison between the two human haplotypes, COX and PGF (http://www.sanger.ac.uk/HGP/Chr6/MHC/). (kb) Kilobase scale. (Bottom) Distance relationships between the four sequences studied. A multiple alignment computed by the MAP program (see Methods) of the two human and the two rhesus haplotypes was split into five regions of equal lengths (approximate boundaries indicated by vertical dotted lines immediately above). Neighbor-joining trees were reconstructed on the basis of the calculated distances, excluding all gaps and correcting for multiple substitutions.