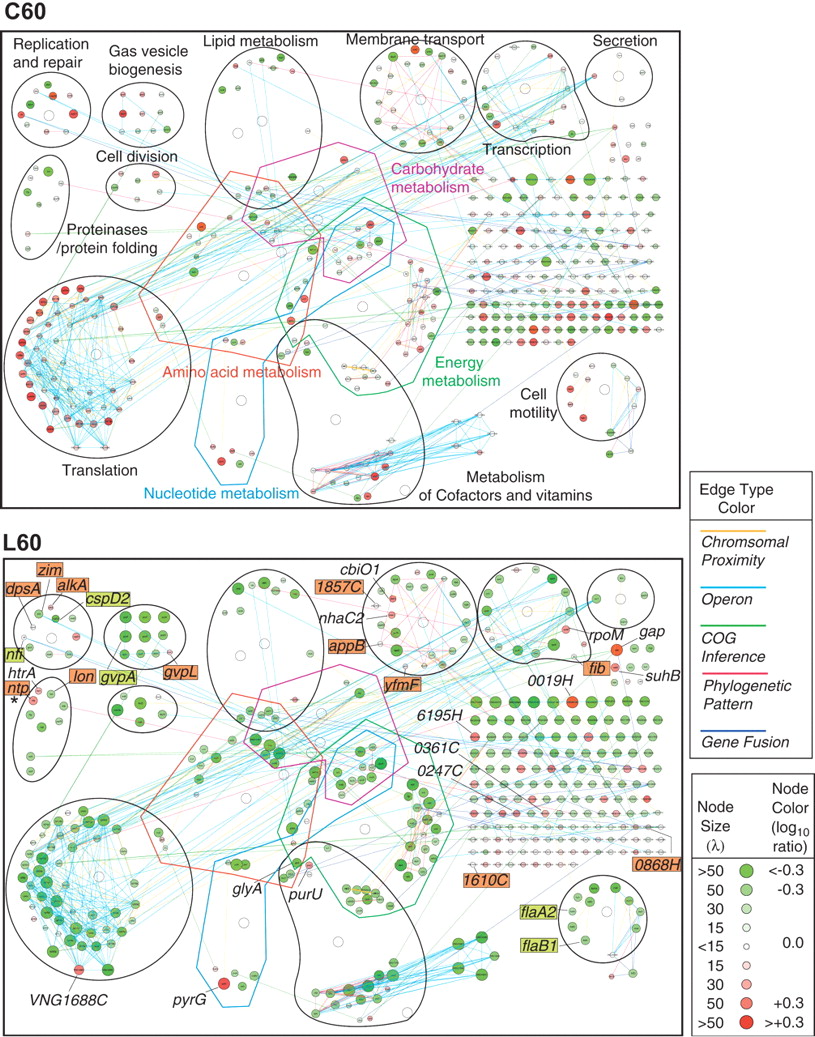
Systems-level visualization of the Halobacterium NRC-1 transcriptome in C60 and L60 with layout organized by general function. The mRNA changes are visualized as a network of genes (nodes) and their interactions (edges). A total of 420 mRNAs that changed during repair or in control are shown with shades of red for increased and shades of green for decreased levels; node size correlates to statistical significance (λ) of change (see inset key). The five types of edges connecting the genes are color coded and described in the text (see inset key for color codes). Representative genes with mRNA changes during repair masked by mRNA changes resulting from the experimental procedure alone are labeled and highlighted with red for a masked up-regulated change during repair and green for a masked down-regulated change during repair. For a complete list of 147 potential masked changes, see Supplemental Table 3. The asterisk indicates the ntp gene, a transposase, which was originally misannotated as a neutral proteinase (see text for details).