Figure 4
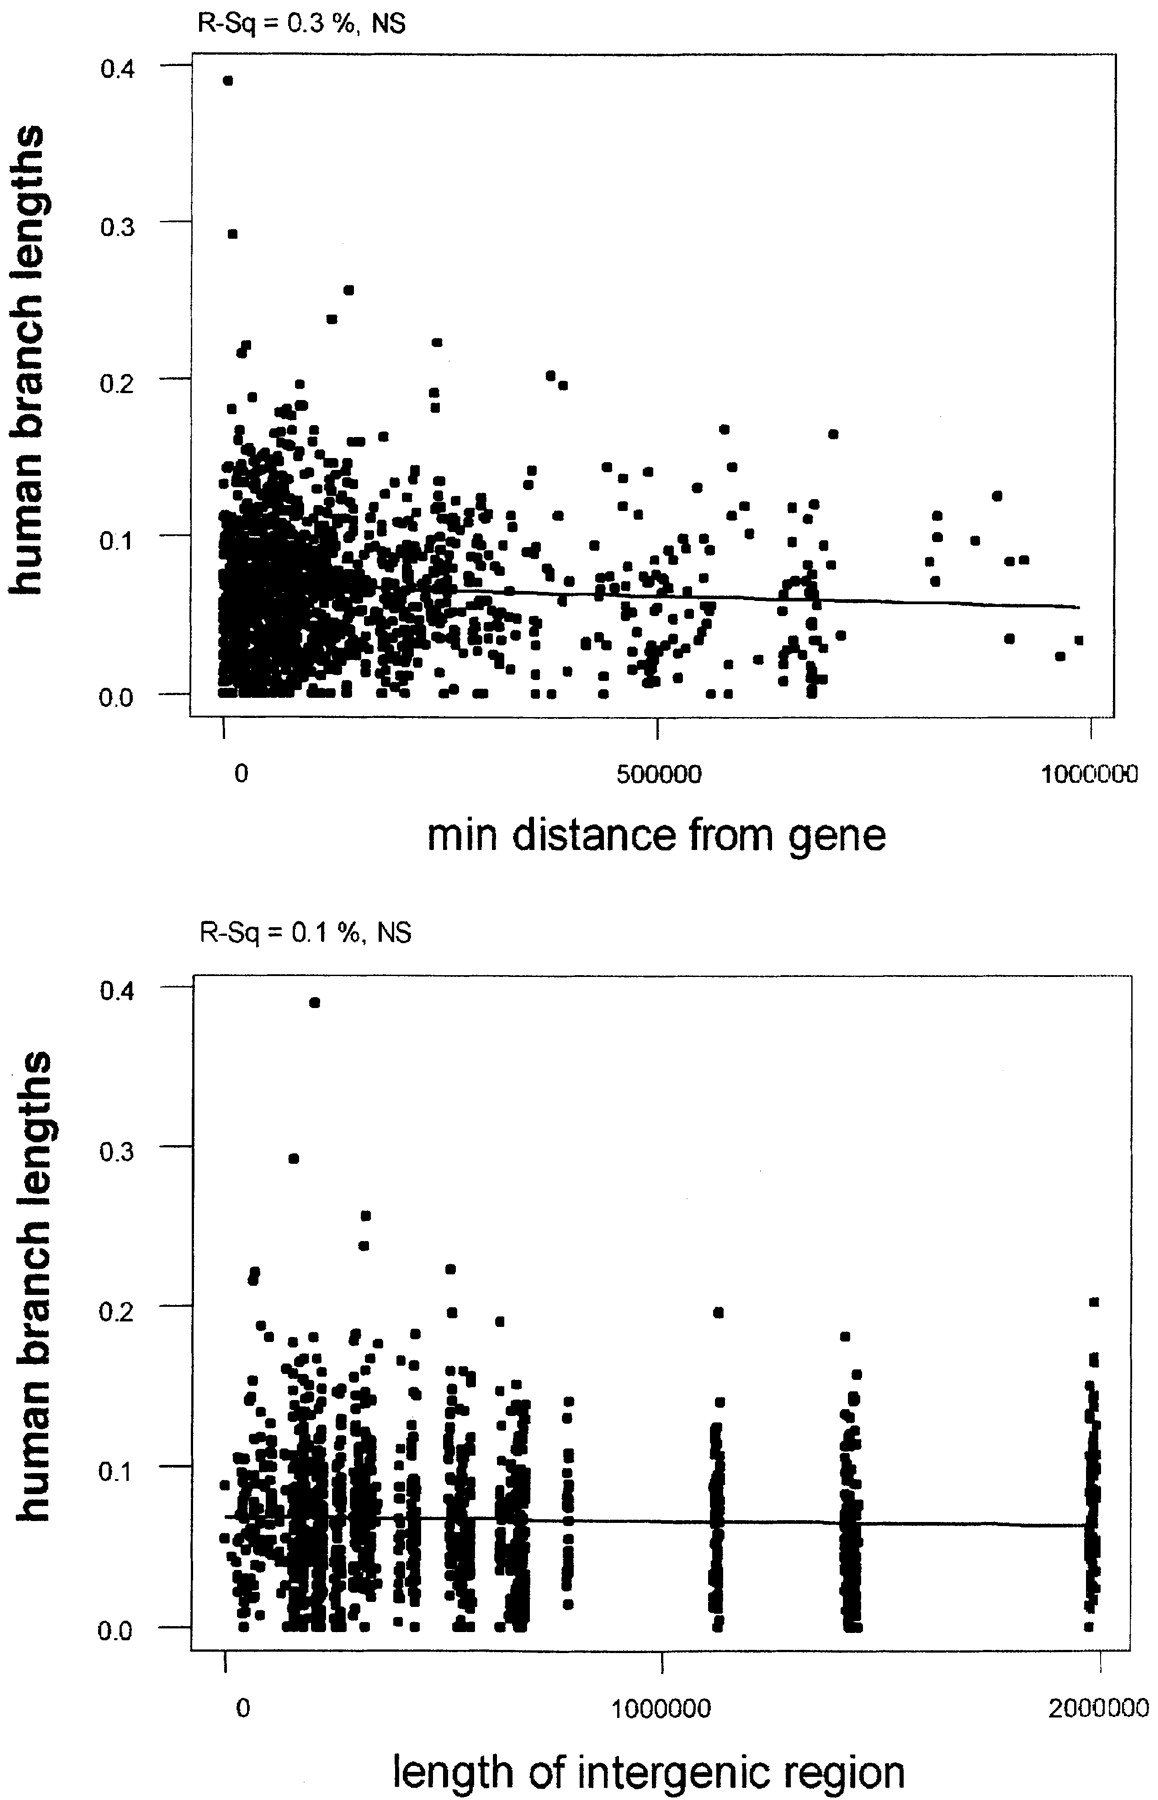
Regression of human branch lengths with the distance from the nearest gene (A) and length of intergenic region (B). Regression lines are indicative. P-values and R-squared values are at the top of the graph.
Regression of human branch lengths with the distance from the nearest gene (A) and length of intergenic region (B). Regression lines are indicative. P-values and R-squared values are at the top of the graph.