Figure 4
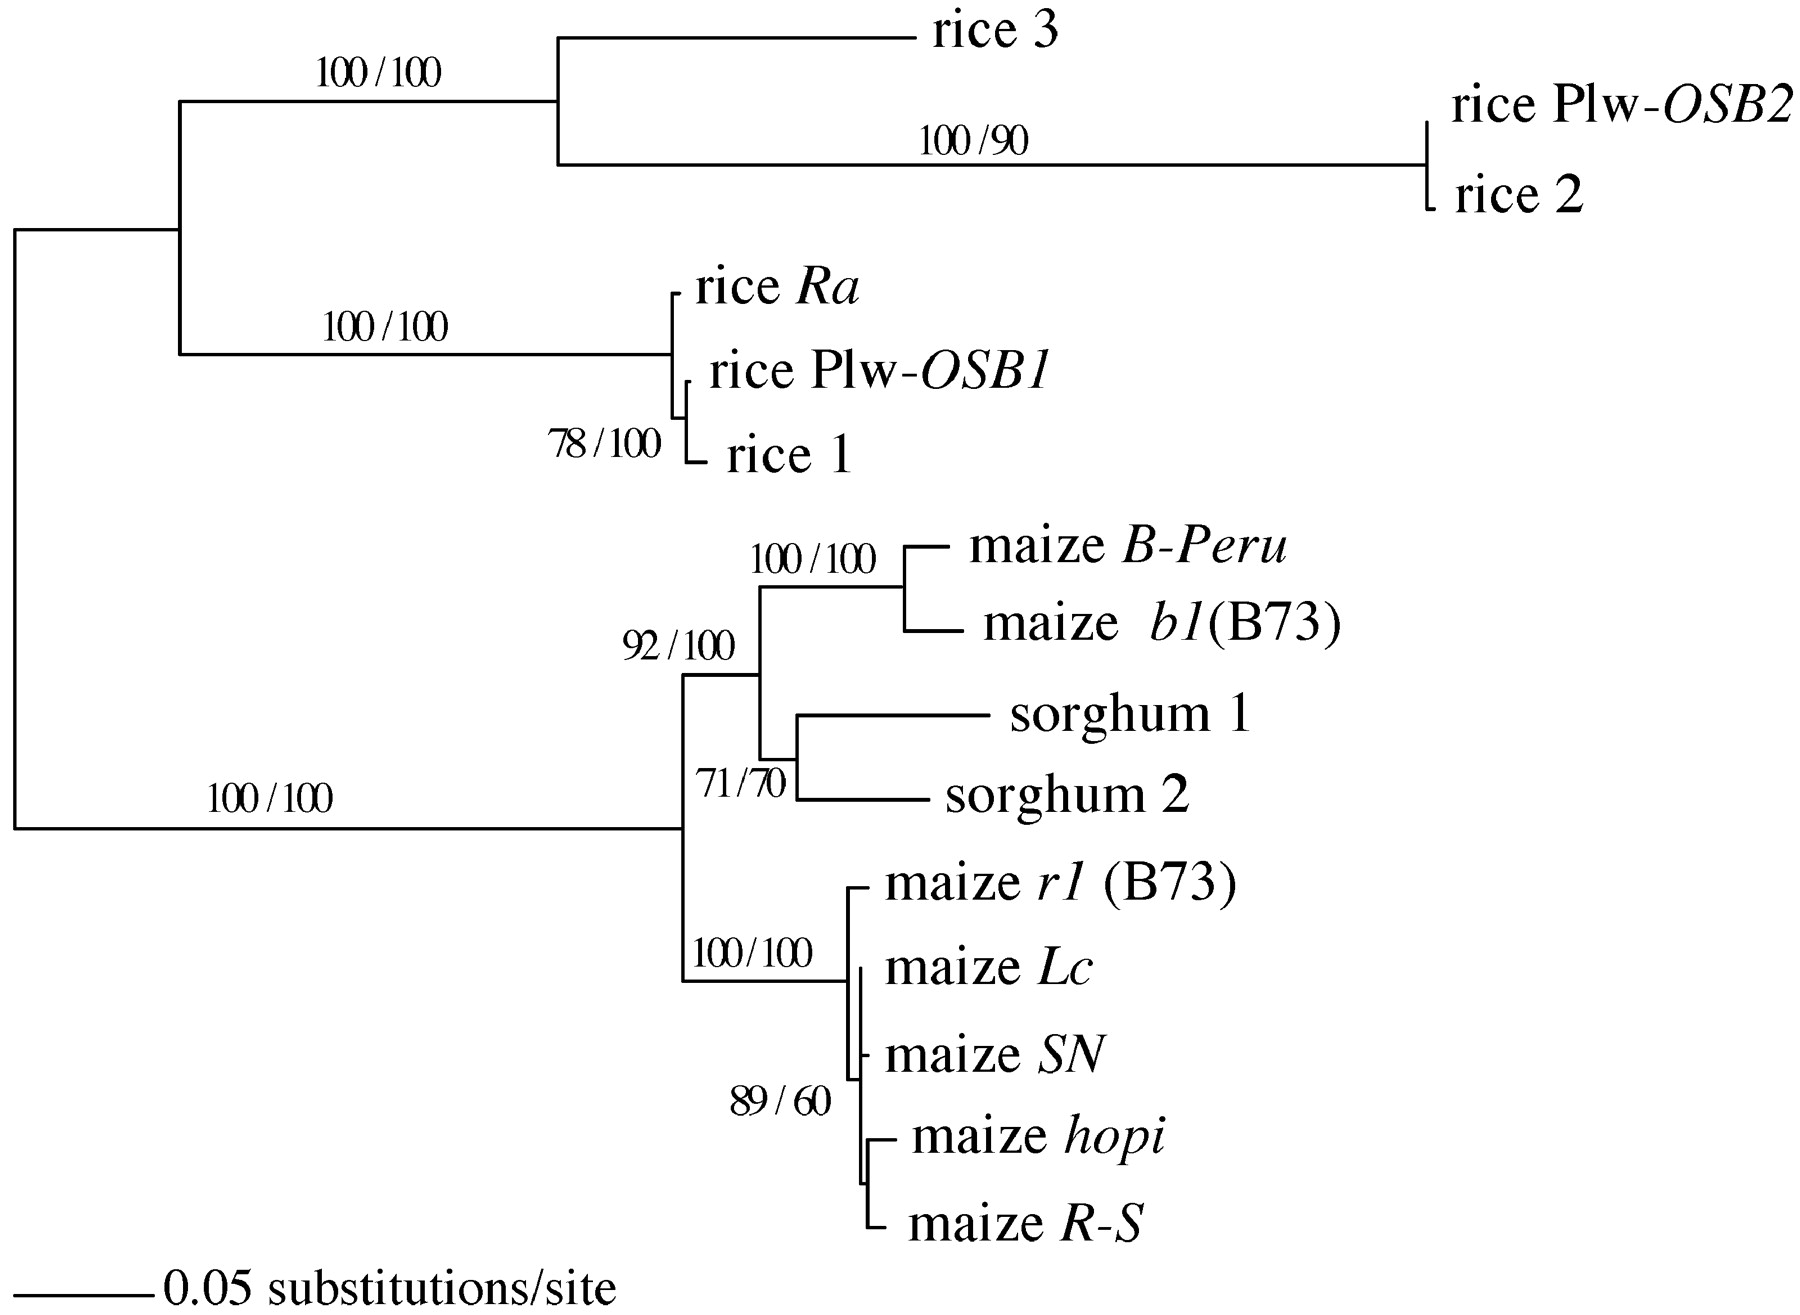
Phylogenetic relationships among r1/b1 gene homologs resulting from ML (GTR+I+G) analysis. The numbers at the internodes represent bootstrap proportions from MP/ML analyses.
Phylogenetic relationships among r1/b1 gene homologs resulting from ML (GTR+I+G) analysis. The numbers at the internodes represent bootstrap proportions from MP/ML analyses.